I posted yesterday morning about how the AEMO was forecasting that NSW “Scheduled Demand” today would climb to 13,500MW on a dispatch target basis. As noted yesterday a level of demand up at 13,500MW would be the highest level seen so far this summer, and would be a level exceeded on only 7 occasions in the past, including summer 2016-17.
As a company full of data junkies operating in the energy sector, we’ve been using our software tools (like the evergreen NEM-Watch v10 entry-level dashboard) to keep an eye on how the market has unfolded over the day. Here’s a few snapshots as the day progressed (all times in “NEM time”, so readers should add an hour to convert to Sydney local time with daylight savings):
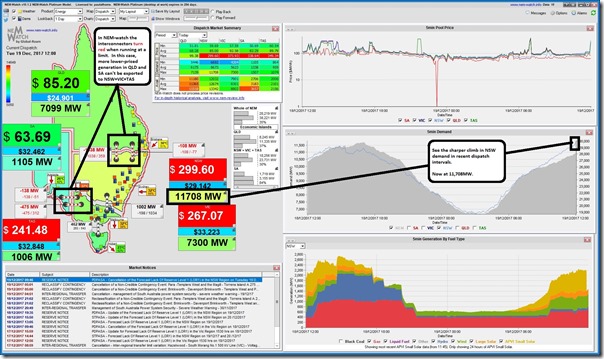
At 12:00 dispatch prices climb for the first time into the red zone
In this snapshot we took from NEM-watch in the 12:00 dispatch interval, we see dispatch prices in the NSW+VIC+TAS “Economic Island” jump to the $300/MWh mark for the first time, driven by the climbing demand levels. Both QLD and SA, separately “protected” by more lower-priced generation than could be supplied in their own regions or be exported further, see prices remain below $100/MWh:
* we coined the term “Economic Island” years ago to indicate that, though the QLD and SA regions are not electrically separated from NSW+VIC+TAS in this case, they are commercially as no more lower-priced generation can reach into the higher-priced regions because of transmission congestion.
At 12:45 the NSW demand climbed past 12,000MW
At 12:45 NEM time, we saw the NSW demand climb to 12,039MW.
At 14:00 the NEM-wide demand climbed past 30,000MW
Perhaps seven our eight years ago, demand levels of 30,000MW were commonplace expectations over summer – not so much these days as a result of the declining demand we’ve seen for whole host of reasons (some good, some not so good).
Hence it’s worth noting that the NEM-wide demand climbed past 30,000MW this afternoon – reaching 30,149MW in the 14:00 dispatch interval.
At 14:55 the NEM-wide demand climbed past 31,000MW
Less than an hour later (in the 14:55 dispatch interval) the demand had climbed another 1,000MW across the NEM (to sit at 31,042MW). This is still 1,000MW below what was forecast on Monday morning to be the demand peak at 17:00 today as shown here (32,280MW forecast on the same basis).
At 15:35 the NSW demand climbed past 13,000MW
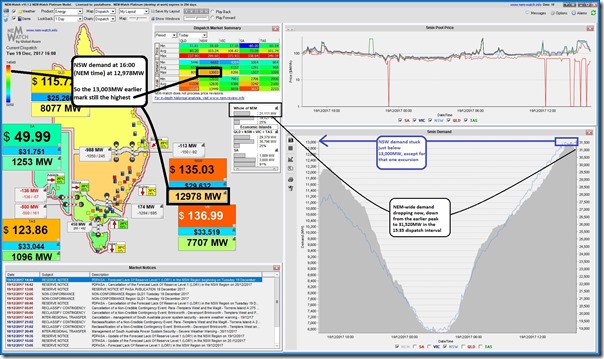
In the 15:35 dispatch interval, we saw the NSW demand climb to 13,003MW – and the NEM-wide demand reached 31,520MW.
However the bump above 13,003MW was to be short-lived, as the demand dropped back below 13,000MW immediately after and remained below that mark for a number of dispatch intervals. Here’s a snapshot from the 16:00 dispatch interval which sees NSW demand up at 12,978MW and NEM-wide demand already declining down to 31,111MW:
We also see that the NEM-wide demand dropped more sharply.
After 16:00 the NSW demand climbed past 13,000MW again (several times)
In the 16:05 dispatch interval (five minutes after the snapshot above), the NSW demand popped back up to 13,002MW. That was also short-lived.
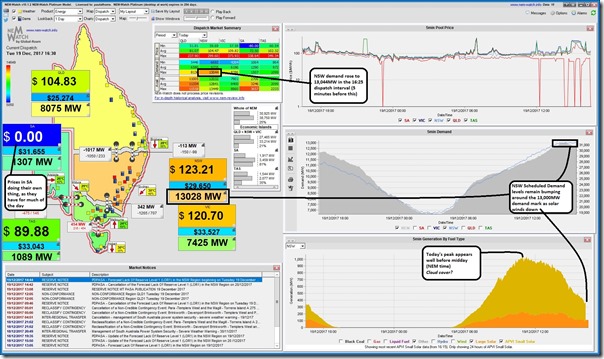
However, with the daily cycle of solar beginning to reach its late afternoon low ebb, as expected we saw "Scheduled Demand" (which is "consumption" minus what’s supplied by generation behind the meter/market, like solar) drive back up – reaching 13,044MW in the 16:25 dispatch interval. Here’s a snapshot of the market 5 minutes later (at 16:30) showing NSW demand at 13,028MW and with the trended NSW generation-by-fuel-type chart focused just on solar (small and large).
We can see that the total contribution from solar in the region is down from a peak today of above 1,000MW to a level of about 300MW (keeping in mind that the APVI estimates for small-scale solar are published about 15 minutes slower than the AEMO metered numbers for large-scale solar, hence explaining the offset in this NEM-Watch chart).
We also see that the NEM-wide has dropped only slightly to 30,925MW.
… perhaps there will be more updates here later
If anything particularly noteworthy happens after publication (and we have time) we might post more about it here…


Be the first to comment on "Hot weather sees NSW demand at 13,000MW and NEM-wide demand above 31,000MW"