The WWF reports that 126 countries and territories participated in Earth Hour this year (at 8:30pm on the 27th of March), up from 88 in 2009 (see our previous post on Earth Hour 2009).
The event has yet again garnered much attention online, with both supporters and detractors (and the inbetween) continuing the global debate of the value on Earth Hour. It seems that discussions are similar to last year – with the general acceptance that Earth Hour’s purpose is to raise awareness, and that substantial additional action still needs to be decided upon, and taken, to make any significant reduction in emissions. The WWF has adopted the slogan ‘Earth Hour, every hour’ for this year’s campaign to encourage continuous application of energy saving practices.
We were curious to see how Australia’s participation affected demand this year, in comparison to previous years. The AFR reports reduced support from Melbourne businesses this year, and in a poll of adults in Australian capital cities, 41% said they had took part in Earth Hour this year (down from 47% in 2009 and 58% in 2008).
Reported Electricity Reduction
Scouting around the internet has yielded demand reduction statistics for a few Australian cities and regions this year. Here’s how they match up against the numbers that we’ve found for previous years:
| 2007 | 2008 | 2009 | 2010 | |
|---|---|---|---|---|
| Sydney CBD | 10.2% | 8.4% | 9% | 6.3% (from EnergyAustralia) |
| Hunter Region | – | 4.3% | 1.9% increase* (from EnergyAustralia) | |
| Melbourne CBD | – | 10.1% | 2% | |
| VIC | – | 3.5% | 3% | |
| Canberra | – | 11.4% | 9.3% | 5.6% (from ActewAGL) |
| Brisbane | – | 9.6% | 6.8% | 2% (from Energex) |
| South East QLD | – | 12.4% | 7.6% | no decrease (from Energex) |
| Tasmania | – | 6.7% | ||
| Perth CBD | – | 2% | 3% (from Western Power) |
* EnergyAustralia attributes this increase in power usage to “a range of factors including unseasonably hot weather on the night, which saw an increase in air conditioner use and to the Newcastle regional show.”
These numbers are from a variety of sources, and may have been calculated in different ways. Some are rounded up, others rounded down – as such the table above is only a rough guide of how power reductions during Earth Hour may be trending. See our previous articles for the sources for 2007, 2008 and 2009. We were unable to find any results for South Australia or the Northern Territory.
Demand in the NEM During Earth Hour
In our previous articles on Earth Hour we used NEM-Review to look at the demand curve around Earth Hour compared to previous and subsequent Saturdays. Consistent with the lower reductions reported this year, the drop in demand is not as prominent (if visible at all) as in previous years.
Queensland
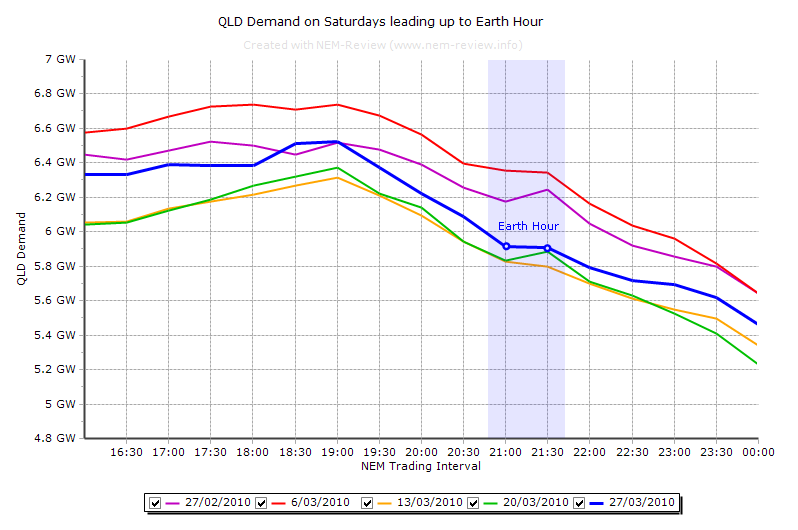
The chart below shows the demand in QLD on the afternoon of Earth Hour (Saturday 27th March), and the demand at the same time on the previous 4 Saturdays.
This year the drop in demand during Earth Hour in Queensland is not as significant as that seen in 2009 and 2008.
New South Wales
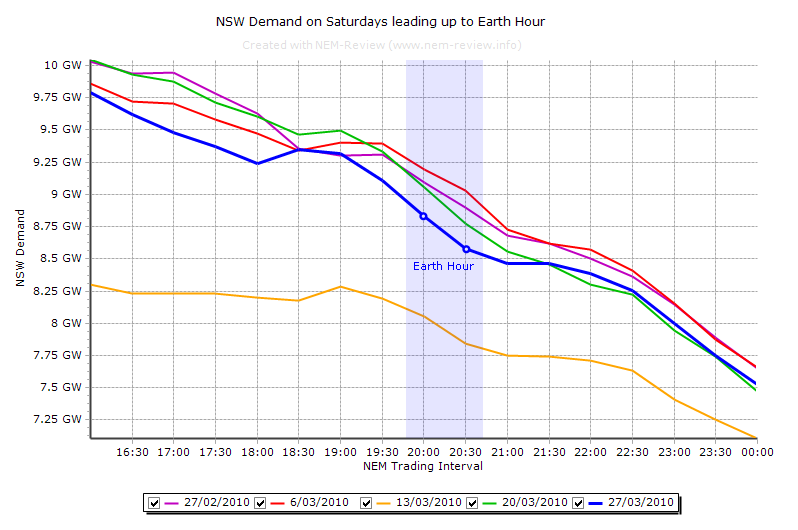
Earth Hour in NSW occurred between 7:30 and 8:30pm NEM time (during the trading intervals ending 20:00 and 20:30) due to daylight savings.
It is more difficult to see any demand reduction here, whereas the drop in demand was quite visible in 2009, 2008 and even 2007.
Victoria
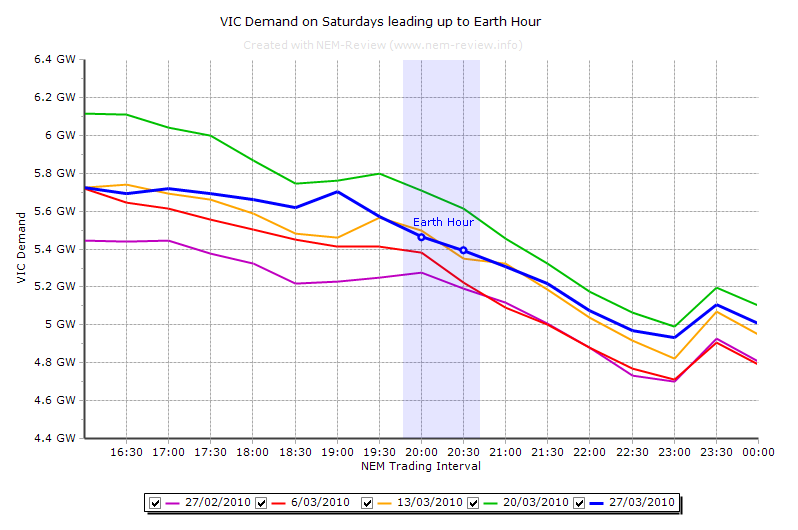
Earth Hour in VIC occurred between 7:30 and 8:30pm NEM time (during the trading intervals ending 20:00 and 20:30) due to daylight savings.
You can compare this to the charts produced for 2009 and 2008, which do not show Earth Hour as clearly as the charts for QLD and NSW in the same years.
Tasmania
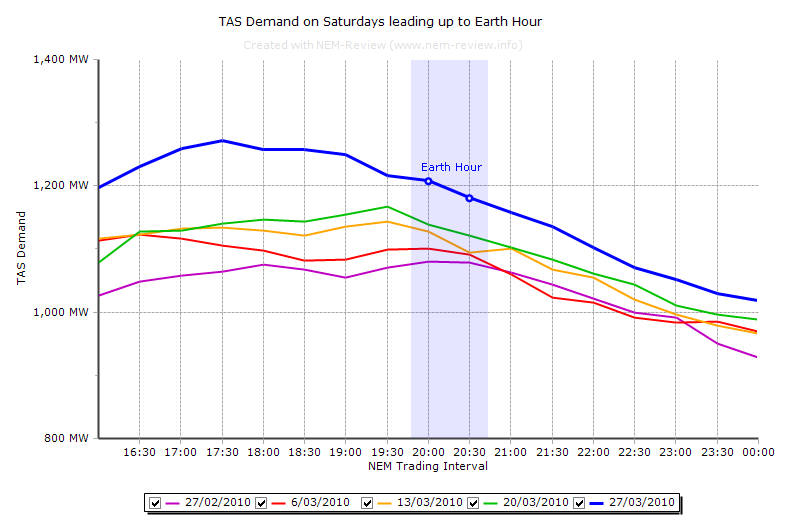
Earth Hour in TAS occurred between 7:30 and 8:30pm NEM time (during the trading intervals ending 20:00 and 20:30) due to daylight savings.
As in our previous charts of TAS demand for Earth Hour in 2009 and 2008, it is difficult to see any demand reduction in this chart.
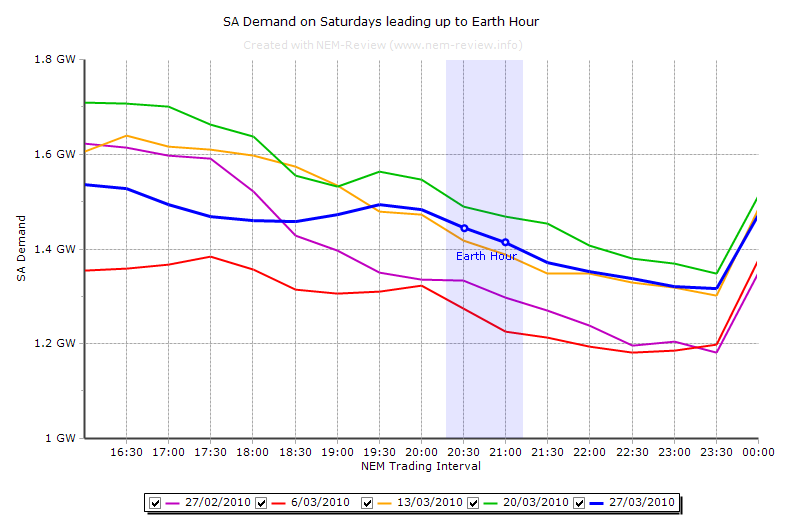
South Australia
Earth Hour in SA occurred between 8:00 and 9:00pm NEM time (during the trading intervals ending 20:30 and 21:00) due to the half hour time difference.
Our previous chart for 2008 showed some possible effect of Earth Hour. Like the chart above, 2009 was less clear.
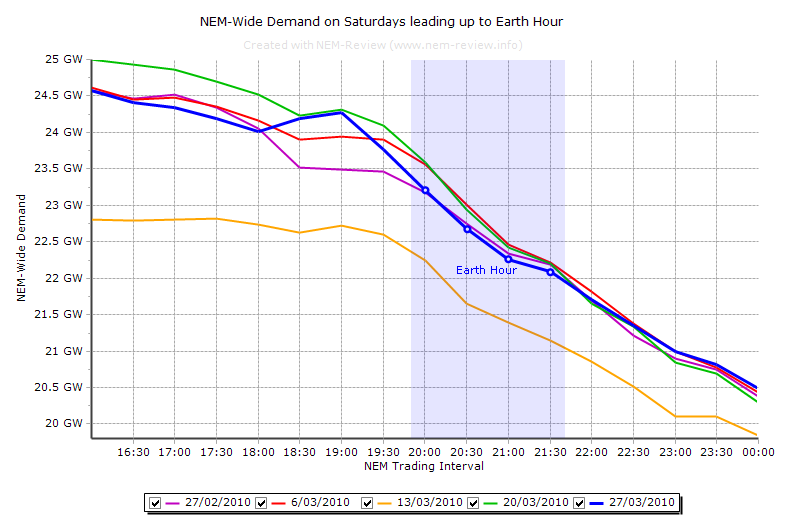
NEM-Wide Effects
The effects of Earth Hour on the entire National Electricity Market span the two hours between 7:30 and 9:30pm NEM time (during the trading intervals ending 20:00, 20:30, 21:00 and 21:30) due to daylight savings.
See charts of NEM-wide demand previously generated for 2009 and 2008 to compare the effects.
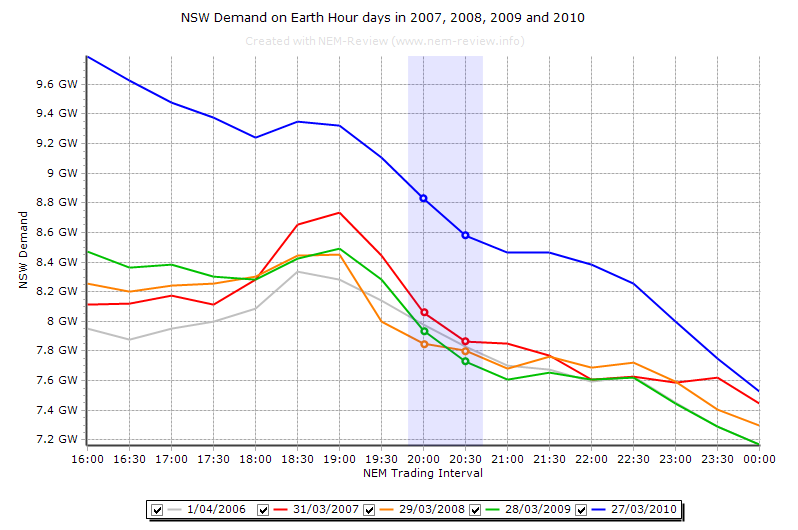
Change in Response from 2007 to 2010
This chart shows the demand in NSW around Earth Hour for the past 4 years, and also the demand on a similar non-Earth-Hour Saturday in 2006 for comparison. Demand levels on the Saturday of Earth Hour 2010 were substantially higher than in previous years (and the 3 previous Saturdays in March 2010 were at similar levels).
Earth Hour Effects Decreased
The reported electricity reductions and our (simple) charts indicate that Earth Hour has had a less substantial effect on demand this year. The AFR quoted Greg Bourne (chief executive of WWF Australia) – “this year there was a lot less change primarily because there is a lot less energy being wasted in Sydney”. Perhaps this is the case all around Australia, or perhaps we’re losing interest, as other articles imply.
Regardless of the demand statistics, the point of Earth Hour is for people to demonstrate their desire to do something about climate change, and to think about what real action they can take in reducing emissions – and WWF appears confident that Earth Hour 2010 has been a success in this regard.


Finding ‘categoric’ data that quantifies Earth Hour results is difficult, and the variables on any given weekend often mask events as narrow as this. However, taking a look at the last 6 consecutive Saturday demands in each NEM sector does give me a little more clarity as to ‘apparent’ effects.
I wont post the graphs and spreadsheet here, but suffice to say that NSW overall appeared to have a subtle 5%-10% nibble, while Victoria and SA shared a larger, longer 10%-15% bite.
Compared to similar views of previous events it seems that Earth Hour is losing its Mojo in Sydney and waning elsewhere in Oz.
Maybe we’ve already achieved so much lighting efficiency by changing over to CFL’s that we barely register a change from turning off lights anymore.
Enough of my highly scientific analysis – over to the experts.