Given that the 2008-09 financial year has just ended, I thought it would be an appropriate time to look into what impact the GFC has had on electricity demand in the NEM.
Year-on-Year change in Average Demand
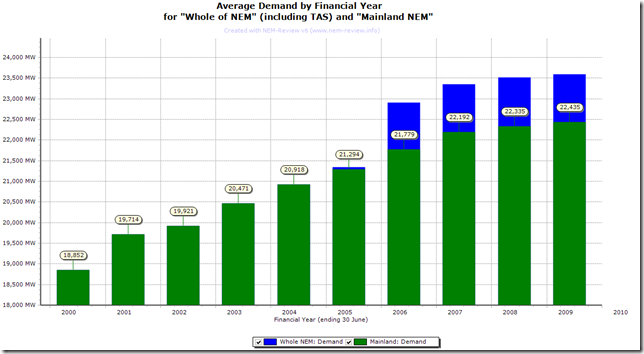
Not having spent much time looking at how total electricity consumption in the NEM had changed over the course of the past 10 years of NEM history, I was surprised to see the results shown in the following chart (generated with a BETA of NEM-Review v6):
In the chart above, we show (in the green bar) how the average demand across the mainland regions has varied from the first full year of NEM operations (1999-2000) through the 10 years of NEM history till the most recent year (2008-09).
In addition, we include (in the blue bar) a view of the additive effect that the Tasmanian region has had on NEM-Wide demand since it first joined the NEM (back in mid-2005).
For the purpose of this exercise, the Mainland NEM numbers are of more interest, as they cover a longer period of time.
Other Reports of the effect of the GFC
We have noted that Energy Quest reported that demand for natural gas had weakened, within Australia, in the most recent quarter – perhaps a sign of the impact of the GFC.
We have also noted with interest how the GFC has had a pronounced effect on the overall level of baseload demand in Ontario, which has led to prolonged periods of low (perhaps unsustainably low?) prices – such as discussed here by APPRO.
What can we learn, with respect to the NEM?
Hence, we were surprised to see (in the chart above) that, even without the impact of the GFC in 2008-09, the overall level of growth in demand for electricity across the NEM seems to have tapered significantly in the last 2-3 years (especially when compared to what had been the case in the early years of the decade.
In table form, the growth factors are as follows:
|
(MW) Growth |
(%) Growth |
|
|
1999-00 to 2000-01 |
862MW |
4.6% |
|
2000-01 to 2001-02 |
207MW |
1.0% |
|
2001-02 to 2002-03 |
550MW |
2.8% |
|
2002-03 to 2003-04 |
447MW |
2.2% |
|
2003-04 to 2004-05 |
376MW |
1.8% |
|
2004-05 to 2005-06 |
485MW |
2.3% |
|
2005-06 to 2006-07 |
413MW |
1.9% |
|
2006-07 to 2007-08 |
143MW |
0.6% |
|
2007-08 to 2008-09 |
100MW |
0.4% |
As can be clearly seen in the table and chart above, growth in demand from 2007-08 through to 2008-09 was the lowest recorded over the past 10 years, HOWEVER it does also appear that this slow-down of the rate of growth in demand is just a continuation of a decline first noted from 2006-07 to 2007-08.
What was the reason for this slow-down?
We would only be guessing if we speculated, but perhaps it had something to do with the “capacity constraints” that were commonly talked about with respect to the Australian economy, up until the GFC struck in late 2008.
Month-on-Month Change
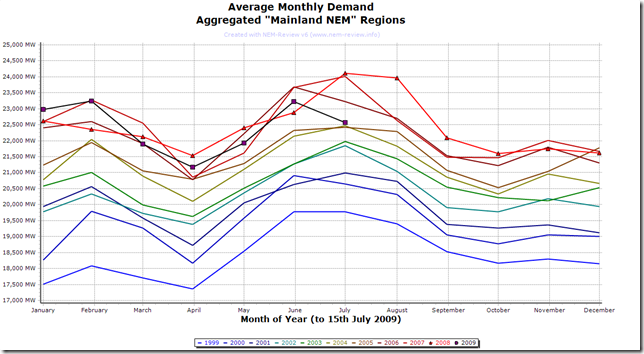
The second chart, included below, provides for comparison of monthly average “Mainland NEM” demand across the 10.5 years of NEM history.
It could perhaps be inferred from this chart that there has been some decline in average demand, on a monthly basis, since November 2008 – however this development (if it is true) is far from abundantly clear.
Demand by Time-of-Day
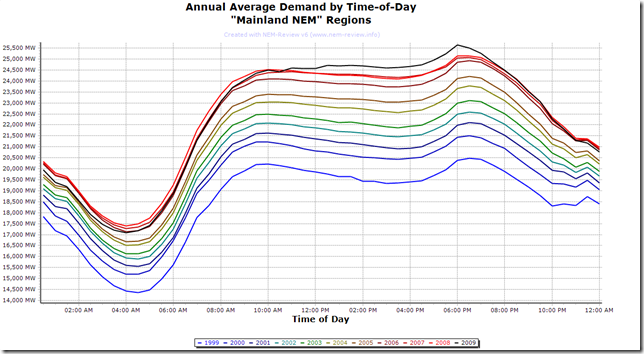
As our final attempt to try to ascertain a clear view of whether (and to what extent) the GFC has had an impact on the demand for electricity across the mainland NEM regions, we have included this final chart, highlighting how the average demand for electricity has trended upwards (on a time-of-day basis) each year since 1999:
Keep in mind, in this chart, that the curve for 2009 has been drawn with only one half of the year’s data (from 1st January to 15th July).
It can be seen, from this chart that the average demand at peak times has increased in 2009 (year to date) but that the average level of demand during off-peak hours has dropped away from the levels experienced in the preceding years (the reduction in demand appears to be of the order of 400MW during low-demand trading periods, such as 4AM).
Hence it may be that the GFC has had an impact on the underlying level of base-load demand in the market – with the effect of this masked, somewhat, by the ever-increasing growth in peak demand for the market (which would be moreso driven by climatic factors, and the increased penetration of air-conditioning).
Conclusion
What conclusion can we reach about the impact that the GFC has had on the level of energy consumed across the mainland NEM – it would seem logical to pre-suppose that the GFC has certainly not helped the situation.
Furthermore, it appears possible that the GFC may have had some effect on reducing the level of all-hours demand across the NEM, but that the level of growth might have been muted, regardless of the GFC, due to other factors that predate the GFC.
Hope this helps!


Leave a comment