
1) Background
“Earth Hour” was a concept developed by the WWF to promote awareness of the risks of climate change.
It first ran just in Sydney in 2007, and generated considerable interest, on both sides of the fence – with both climate change sceptics and climate change believers becoming very vocal about the value (or otherwise) of the event.
Further information about Earth Hour is provided by the WWF on the dedicated website:
http://www.earthhour.org/
Since that initial event, Earth Hour has been held at the same time on two successive years, with an increasing number of locations around the world participating – and still continues to galvanise commentary by supporters and detractors alike.
Following the conclusion of Earth Hour 2009, out of interest we thought we’d have a closer look at what happened in Australia’s National Electricity Market over the period, leading to the preparation of these three articles:
- Earth Hour in the NEM 2007 (this article)
- Earth Hour in the NEM 2008
- Earth Hour in the NEM 2009
Disclaimer –
Please note that we’re not PhD-powered analysts/consultants in the energy market, nor are we climate change scientists (or sceptics).
We’re just a bunch of geeks who spend some time watching the electricity market with the software we’ve created. In the process of doing so, we make some observations, some of which we publish online here.
As such, we’re neutral about the usefulness of Earth Hour, as a concept – and about the climate change, in general. We’re the first to admit that we don’t have the background and training to even begin to add constructively to whether anthropogenic global warming (AGW) is happening, or not.
We are just aiming to maintain our software such that it continues to be useful in helping people to understand the electricity market – whatever form of carbon pricing it includes in future.
Plus we’re just curious…
We’ve published this information here as you may be interested, not because we believe it is definitive on the topic. Indeed, we fully accept that we may have overlooked a number of things (possibly big ones).
2) Contents
1) Background
2) Contents
3) Reported results
4) Criticisms
(a) David Solomon’s analysis
i. Can an individual “Make a Difference”?
ii. How big was the reduction, anyway?
iii. What’s the significance of the reduction?
iv. Discretionary household electricity usage
v. Did people merely defer their consumption?.
vi. The rise of the “Eco-Warrior” and the “Green-Hater”
(b) Photographic Record
3) Reported results
Earth Hour in 2007 was organised between 7:30pm and 8:30pm on Saturday March 31st 2007.
Note that, as daylight savings in NSW ended the week before Earth Hour 2007, 19:30 NSW time equates to 19:30 NEM time.
The stated purpose of Earth Hour in 2007 we believe (it’s hard to find the original sources – but this later reference on the Sydney Morning Herald site does state this metric) was to encourage people to find a 5% reduction in individual carbon emissions over the hour (setting the scene for a sustained 5% reduction over the following year).
The WWF, on their website, reported the outcomes of the inaugural Earth Hour event as follows:
- In a survey of 937 Sydney residents, 57% of respondents professed to have taken some action to participate in Earth Hour:
- The majority of these participants opted to turn off lights, whilst some turned off a computer, the TV, or some other appliance;
- This result was extrapolated to imply that 2.2M residents participated
Just to clarify – we believe that this is meant to indicate that this is 2.2M people, as opposed to 2.2M residences (as that would not seem plausible).
- The WWF reported a reduction in energy usage of 10.2% across the Sydney CBD:
- This was reported by EnergyAustralia on its website the following Monday, and later echoed in a report made to NEMMCO’s Market Information Forum as noted in these NEM IF minutes from 26th April 2007;
- The EnergyAustralia report noted that:
- the 10.2% reduction in demand in the CBD equated to a reduction in consumption of 23,280kWh within the CBD (hence against a 5% target, this was deemed to be a stunning success);
- this reduction within the CBD was reported as being equivalent to removing 24.86 tonnes of CO2, emissions (which implies a rate of 1.07kg/kWh – which is fairly consistent with the published greenhouse intensity factor for the NEM)
- by extension, the WWF report equated the CBD reduction to the removal of 48,613 cars from the road over the hour period (or 0.5kg/car/hour).
- On top of this reduction within the CBD:
- EnergyAustralia reports an additional reduction of approximately 25,500kWh in the rest of their distribution area:
- Hence totalling 48,760kWh in the EnergyAustralia distribution area;
- Equating to 52 tonnes of emissions (again at 1.07kg/kWh);
- Representing 101,800 cars for an hour (again, approx 0.5kg/car/hour).
- The WWF also reports Integral Energy (distribution company for Western Sydney) as stating there was an observable drop in consumption:
- No specific figures are quoted in the WWF article – though we did not spend much time searching for them elsewhere!
- The WWF report quotes Integral as stating “We noticed a steep decline in the first five minutes of Earth Hour, between 7:30 and 7:35pm – equivalent to the amount of electricity needed to power 6,500 homes”. Hence we take this to mean 6,500kWh over the hour, attributable to the drop over the first 5 minutes (if sustained for the hour). However, it’s possible the reduction could have been greater, over the hour, if the demand kept falling.
- We have not searched for any commentary about Earth Hour from Country Energy (the 3rd distribution company in NSW) as Earth Hour 2007 was focused solely on Sydney.
- In total, then, the reduced consumption would seem to have been in excess of 55,000kWh:
- As noted above, the precise magnitude of the reduction is not possible to determine given the lack of data from Integral Energy;
- A reduced demand of 55,000kWh over the hour would equate to a linear drop in consumption of approximately 110MW over the hour.
The inaugural event was hailed as a success by the WWF, and by others – though not by all…
4) Criticisms
Given that this article was prepared in April 2009 (two years after the inaugural Earth Hour) we have tried to scan and collate the various criticisms levelled at Earth Hour 2007 into the following categories.
Note that this listing is included in relation to criticisms that were raised with respect to Earth Hour 2007 at the time. In subsequent years, it has emerged that criticisms have become more vocal – space has been provided in our analysis of Earth Hour 2008 and Earth Hour 2009.
Despite our efforts, no doubt we have missed a few – so feel free to add your comments at the bottom (but please try to be factual).
(a) David Solomon’s analysis
About 6 weeks after the staging of Earth Hour 2007 (on 9th May 2007), David Solomon (a finance PhD student at the University of Chicago) wrote this critique in the Australian. In this article, David references his research paper here.
Firstly, we should provide full marks to David given that he was able, in only 6 weeks and from a foreign country, was able to provide this level of analysis – whereas it took us more than 2 years to get this (more cursory) article together!
Upon first finding this article, back in 2007, we downloaded David’s paper for later reference, and upon returning now, we find that David updated his paper in 2008. Hence both copies are included below, for your reference, in case David updates his paper again:
David’s main findings, in his analysis, seem to be as follows:
- David’s main point is that the measured response (which he assesses as 2.1%) was
- In his analysis, David highlights the difficulties of accurately determining what would have been, in the absence of the Earth Hour effect. Hence, this highlights how difficult it is to ascertain the actual effect of the Earth Hour efforts (or, by extension, any other load curtailment event);
- David continues that:
- In his first draft (though we note it was removed from the second draft) David postulated that:
- In his second draft, David introduces further analysis to support his argument that
“statistically indistinguishable from zero”
“discretionary household electricity use like lighting forms only a small component of total electricity consumption, and policies targeting such use may be of limited impact”
“consumers might have simply brought forward electricity consumption that they would have otherwise had during Earth Hour, causing increases in electricity use beforehand”.
“… is consistent with consumers feeling pressure to overstate their preferences for environmental goods”.
In the following sections, we have given each some consideration to each of these points.
i. Can an individual “Make a Difference”?
In his note in the Australian, David states that his aim was to identify whether it is truly possible that “small changes to your daily routine can add up to big changes in helping to stop global warming” – as referenced from Al Gore’s film “The Inconvenient Truth”.
Note that:
- We certainly agree that the question needs to be asked; and
- We believe that the answer (especially in the case of Australia) is that large changes will be needed, as well (for instance, in the technology mix of generation capacity) if anything like a 60% reduction is to be achieved by 2050.
However, given that the stated objective of Earth Hour 2007 was (as best we can determine) only a 5% reduction over the hour – as a seed to achieving a 5% reduction in consumption across the year, it’s perhaps inappropriate to use the results of Earth Hour as a definitive guide to the answer.
David has shown from his results that such efforts can have some effect – even if they are insufficient (in their own right) to get Australia all the way to the 5% reduction target by 2020.
ii. How big was the reduction, anyway?
Following David’s analysis, he concludes that a reduction in total consumption across NSW was achieved of approximately 2.10% – which (David says) is “statistically indistinguishable from zero”.
As noted above, the Earth Hour 2007 event was focused specifically on the people of Sydney (and particularly in the Sydney CBD). It appears that it was not until subsequent years (from what records we have found) when significant efforts were taken to enlist residents outside of Sydney to participate in the event.
Using an approximation that Sydney equates to 1/2 the electricity consumption of NSW (not an unreasonable approximation), just taking David’s figures would imply that the reduction in demand in Sydney would have been of the order of 4.2% of total energy consumed over the hour within Sydney. If these numbers were correct and given the organiser’s apparent goal of a 5% reduction, then we would presume that the WWF (and other organisers) would have been reasonably happy with the results.
However, there is still an apparent anomaly between the results derived by David (6 weeks after the event) and those quoted by EnergyAustralia (within 48 hours).
With respect to the two different analyses, we note that:
|
EnergyAustralia analysis |
It is stated (in the report to the NEMMCO Forum) that this analysis was both:
No further specifics were provided of how this normalisation was performed – however a chart is provided that indicates a “with” and “without” forecast of demand in the Sydney CBD – highlighting the 23,280kWh reported reduction. |
|
David’s analysis |
David states in his report that he has applied As a conclusion to his analysis, David concludes a drop in consumption of 168-173 MW over the hour (or 168,000-173,000kWh). |
Hence, both studies have claimed to normalise the data to account for weather patterns and the like.
The main difference between the two is that the EnergyAustralia analysis focuses just in their distribution area (and mainly in the CBD) whilst David’s analysis spans all of NSW. Given the results shown in the table above, it would appear that the two numbers are not incompatible – especially for an event that was focused on the Sydney area (and particularly the CBD).
We have no basis for determining the validity of either number. However both reports do highlight the difficulties inherent in measuring the impacts of events such as these – for instance, if David had wanted to analyse the impact of Earth Hour just within the Sydney CBD, he would not have been able to do so, as this data is not in the public domain.
Looking further into the EnergyAustralia analysis, we see that:
- Specifically, the EnergyAustralia figure of a 10.2% reduction within the Sydney CBD, whereas the implied 4.2% reduction would have applied across all of greater Sydney.
- From the figures quoted above from EnergyAustralia and the WWF, it appears that the response was most significant within the CBD (in percentage terms) whilst becoming more muted outside of the CBD, and possibly very muted in Western Sydney (in Integral Energy’s distribution area).
We have not done any further digging, but would speculate that this outcome might have arisen for a number of reasons, including any (or all) of the following:
- From a technical point of view, we suspect (though we have not checked) that lighting might equate to a higher percentage of electricity usage in and around the CBD (compared with the suburbs);
- Following from this, it’s also possible that a smaller number of parties are responsible for a larger number of lights than in the suburbs (fewer hands on the light switch, so to speak, hence easier to organise a concerted response);
- Given that the media centred its focus on the Sydney CBD in the reporting of the event, it’s feasible that people in the CBD (be they residents or businesses) felt more pressure to take part in the event than people in the suburbs; and
- It’s commonly reported that the people in the (more affluent) inner city areas are more “environmentally conscious” then the (less affluent) suburban-dwellers. Hence it may be that they would have been more inclined to participate in something like Earth Hour anyway.
Note that the above factors are purely speculation, and that we have not taken the time to look into them further.
iii. What’s the significance of the reduction?
In his conclusion to his piece in the Australian, David makes the note that:
The environmental effect … was reported rather optimistically by Sunanda Creagh in The Sydney Morning Herald as being the "equivalent of taking 48,613 cars off the road for one hour".
(our emphasis added)
For those who are interested, Sunanda’s comments are here. In the next sentence, David proceeds:
Melbourne Herald Sun columnist Andrew Bolt, displaying a perhaps firmer grasp on the true economic significance of the event, noted that this meant taking a paltry six cars off the road for a year.
(our emphasis added)
For those who are interested, Andrew’s comments are here.
It seems to us that both figures are correct:
i.e. 48,613 cars over the hour / 8,760 hours = 5.5 cars over a year
In this case, the difference in emphasis reflects merely each author’s own bias about the significance of the event (a bit of “journalistic licence”, as it were).
Given that the Earth Hour was an event running over an hour, it would seem to be more correct (strictly speaking) to provide an equivalent measure also over an hour. As a PhD student in a discipline focused on numerical analysis, David (surely) would have understood this – perhaps indicating his own personal bias?
iv. Discretionary household electricity usage
In his analysis, David raises the point that:
David also repeats the results quoted by the WWF in that (of those surveyed who did participate) the switching of lights was easily the most common action taken:
- It appears that it was 53% in total who did this, with 57% who professed some involvement (we think this means that 93% of active participants turned off their lights);
- In contrast only 25% of the total turned off their computer (hence 44% of active participants);
- Similarly, only 25% (hence 44% of active participants) turned off some other household appliance;
- Finally, only 17% turned off their television (hence 30% of active participants).
It is understandable that the light switching was, by far, the most common activity, as this was the focus of the marketing leading up to the event.
We speculate (though we have no way to prove this) that the response was perhaps something like 50% of active participants just turning off lights, with the other 50% (being very keen) taking 2 or more actions.
The overall result achieved through Earth Hour does indicate the magnitude of the challenge Australia faces if it is to meet both:
- Its stated 5% greenhouse gas reduction target by 2020; and
- Its aspirational 60% greenhouse gas reduction target by 2050.
Specifically, if conducting Earth Hour in Sydney 2007 resulted in a reduction of the order of 5% over the hour of the event (across Sydney), then we will need to be doing significantly more than this to meet a 5% reduction in greenhouse gas emissions by 2020, because:
- Electricity usage is only one component of Australia’s greenhouse gas emissions (albeit the largest contributor);
- We only use lighting for a small fraction of the day:
- The country’s electricity demand (hence growth in emissions) is forecast to grow considerably through to 2020 as a result of population growth, and growth in industry. This will make the 5% reduction target even tougher.
A ball-park estimate would be perhaps 6 hours out of 24 hours in which lighting would be sustained at the level normally experienced at 19:30 – meaning that the response would need to be four times as large to equate to a 5% reduction overall. Even assuming 100% participation, this would only bring the level up to 2 times (roughly)
Hence lighting reduction would not be enough – and who wants to live in continuous darkness, anyway?
However, this would indicate that the replacement of old lights with energy-efficient ones should contribute a sizeable amount of greenhouse reductions (and move us closer to the 5% target).
As has been repeated endlessly by any number of different sources, for Australia to meet a 5% reduction target by 2020 would be a significant challenge, and would take more than just moderation of electricity consumption (especially at just a residential level).
That said, there may have been some value in the event, as it seems to have brought many people (from the green-agitators, through the full-spectrum to the green-haters) to better realisation of what a 5% reduction actually represents (personally, and as a country). Perhaps this was part of the reason the WWF championed the event?
v. Did people merely defer their consumption?
In the first draft of the report, David referenced this blog post by Andrew Landeryou which claims to show that Earth Hour succeeded only in shifting people’s consumption patterns earlier than would otherwise be the case.
In the chart included in the blog post (which was prepared for Andrew by an author identified as “Patriot with Spreadsheet”), demand curves for the NSW region on two other days in March were compared against the demand curve from the Earth Hour day to illustrate a claim that the staging of Earth Hour 2007 actually influenced (in some way) people to bring forward their consumption of electricity, rather than just curtailing.
Note that the deferral of consumption is not necessarily a totally worthless activity – if it occurs at the time of peak demand (as growth in peak demand is far exceeding growth in average demand). Indeed, there is an increasing emphasis being placed on the use of demand side response as a means of deferring massive capital expenditure (in generation and distribution infrastructure, generally) – which is a very worthwhile objective.
However, for the purpose of this exercise, it is important to note that such deferral of consumption would have little impact on reduction of greenhouse gas emissions.
Hence, if it were true, this would be reason to be more sceptical of the environmental benefits claimed for Earth Hour.
However, the following chart (generated in Excel with data sourced from NEM-Review v5) provides illustration of the most likely explanation.
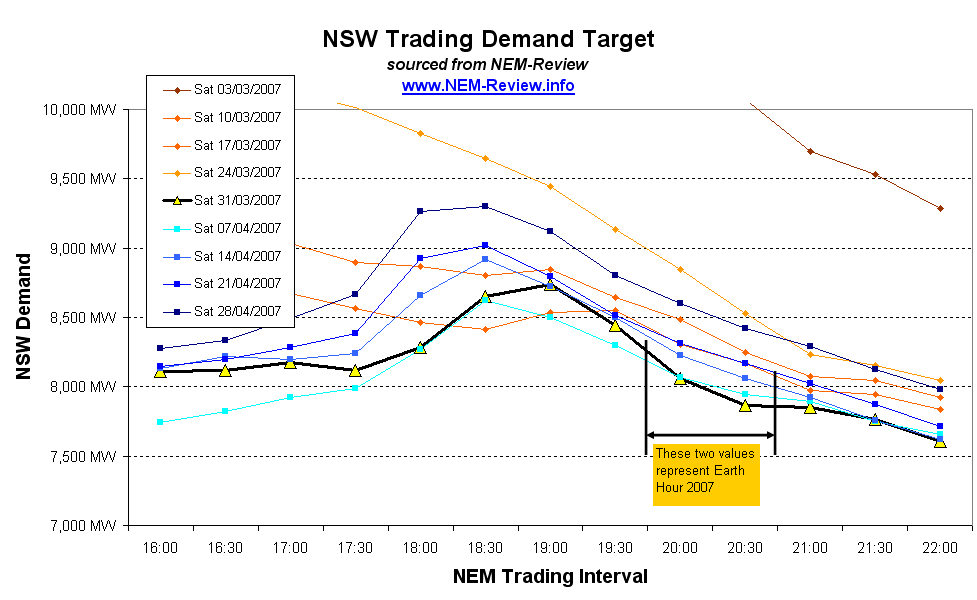
All times shown in this chart are NEM time (hence independent of daylight savings time in NSW). Hence, it is possible to compare one Saturday’s demand against the next Saturday’s.
From this chart, it can be clearly seen that the demand shape through March and April progressively moved towards a “winter shape” typified by a pronounced spike in demand around 18:00-18:30 (due to earlier domestic lighting, and heating demands). We wrote about this winter demand shape in relation to generator bidding behaviour previously.
For the purposes of this analysis, it is clear that the spike in demand seen at 19:00 (i.e. before Earth Hour started) was nothing more than a seasonally impacted load shape. The fact that Andrew has chosen to reference a chart comparing earth hour (in 2007) against two Saturdays earlier in March (and from 2006) does seem a little selective.
Incidentally, a simple eye-ball comparison of the Earth Hour load trace (above) against similar load curves (particularly 14th and 21st April) would tend to indicate a state-wide reduction of approximately 200MWh would seem a reasonable conclusion (along the lines of that deduced by David Solomon).
We note that this argument was removed from the second draft of David’s report. We would infer from this that David (quite rightly) questioned the validity of this argument.
vi. The rise of the “Eco-Warrior” and the “Green-Hater”
The second draft of David’s report was interesting, for two main reasons:
- Firstly, David proceeded to include a greater explanation of the methods he used in performing his statistical analysis (though not to the stage whereby his results could be replicated by another);
- Secondly, David opens up the question of whether people felt compelled to over-state the degree to which they participated in Earth Hour following the event (because of social pressure). David postulates that this pressure may have been greater due to the nature of the survey approach
We do not know, but it seems David supposes the survey was conducted via face-to-face means, or via telephone – this seems likely, given that the “results” were published shortly after Earth Hour.
Based on our own personal experience, and what we have read from the likes of Robert Cialdini, we would agree that this is a distinct possibility.
What’s equally apparent to us is that the inception of Earth Hour has hastened the evolution(?) of two distinct types of personality, which we have loosely termed as:
|
The |
A person who believes firmly in the truth of anthropogenic global warming (AGW), and takes it upon themselves to effect change in greenhouse emissions – to the extent of impacting on other person’s liberties. For instance, blog posts about neighbours who had their power forcibly disconnected (i.e. fuses switched) during earth hour would typify this type of person. |
|
The |
On the other side of the coin, there are many who do not believe that AGW is occurring (or that it is a significant threat). Some of these, it seems, adopted (or at least claimed in the posts to have adopted) an illogical position of seeking to use more electricity than normal as demonstration of their beliefs, and a protest against Earth Hour. |
We have only conducted a review of a small percentage of the large number of articles written (and blog posts made) on the right- and left-side of the Earth Hour debate – though this still did take us some time.
It’s apparent in these blog posts that a significant percentage of people have become polarised on either extreme of this debate.
(b) Photographic Record
One other criticism we have found are claims of journalistic bias on the part of those reporters who are seen to support the Earth Hour concept.
For instance, it has been claimed that the media has been selective in the use of photographs that provide the best visual effect of the reported reduction in electricity consumption over Earth Hour. This criticism was picked up and reported by the ABC’s Media Watch program on 9th April 2007.
One industrious blogger (Bruce) has taken the time to put together this analysis of the efforts taken with photographic records of the events.
Leave a comment