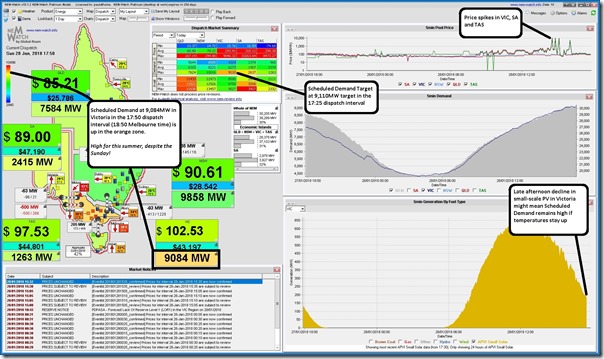
During yesterday evening’s I posted this snapshot from NEM-Watch v10 on Twitter, highlighting how Scheduled Demand in Victoria was up above 9,000MW – and was likely to remain up there whilst temperatures remained high:
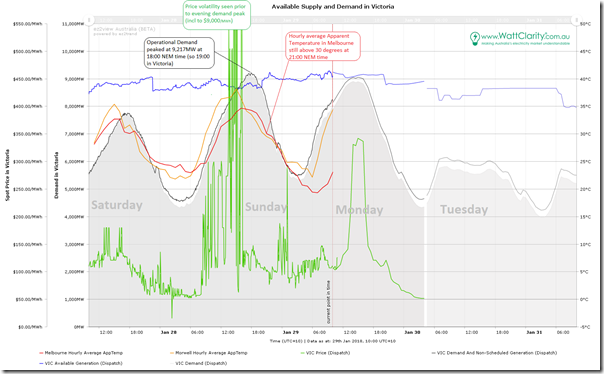
It’s worth following that image with the following web-based trend from ez2view Time Series Data Viewer (clients can access the live view here):
As noted in that chart, the hourly average Apparent Temperature at Melbourne airport remained above 30 degrees until after 21:00 NEM time (22:00 Melbourne time), which suggests some pretty uncomfortable attempts to get to sleep early for those who had to do so (and did not have air-conditioning, or were affected by the distribution-level network outages).


Be the first to comment on "Sunday 28th January sees Victorian electricity demand (Scheduled, and Operational) above 9,000MW"