

We’ve already written 3 articles about the earlier-than-expected start to the long (mostly) planned outage of Loy Yang A1 early in the morning of Monday 7th September 2026:
- we wrote ‘Unit trip at Loy Yang A1 on Monday morning 7th September 2026 (part 1)’
- then ‘A second look at Loy Yang A1, after trip on Monday 7th September 2026’, in which we highlighted how the forced outage ran straight into a lengthy planned outage
- then ‘A (minor) drop in System Frequency, with trip of Loy Yang A1 at 03:58 on Monday 7th September 2026’, to help identify:
- The precise timing of the trip (at 03:58:28 on a 0.1 second cadence); and
- The (relatively minor) effect on system frequency (a drop to to 49.956Hz).
Some voltage issues coincident with the trip?
Soon after it happened, we heard (from various different sources) that there were voltage issues experienced at the time:
1) A few people approached us directly (we won’t name them here, to protect their anonymity)
2) But it’s probably useful to link to this question on Facebook (of all places*) at that time:
* note the commonality of name of the Facebook Group with our NEMwatch software application (but note no link to us at Global-Roam Pty Ltd directly, other than that the people who set up this group liked our NEMwatch Widget for RenewEconomy)

With their permission, we also thought it would be of interest to share this video recording taken by a particular NEM stakeholder’s front door security camera (located in postcode 3336 – Frasers Rise) of the flicker on outside lighting – which we assume was coincident with the voltage dip at their house:
1) This was at approx ~03:58:19, according to the time on the video;
2) Which is ~9 seconds before the measured time on the frequency drop (assuming both timestamps are accurate).
Searching for data to analyse…
Voltage data is not amongst the data we routinely collect (and is generally quite location specific, in any case), so the event started us hunting for data that would help us understand – and answer – some of the questions that we fielded.
From Solar Analytics (Catch Power)
One of the places we arrived at was the front door of Solar Analytics who we have used for data extracts on some occasions in the past (sometimes we’ve remembered to tag articles with ‘Solar Analytics’, but unfortunately not comprehensively).
For a modest fee, they were happy to extract us a range of data (some at 5-second cadence … see more details below) for devices located in and around Melbourne, for a time-range that included the trip of Loy Yang A1.
Associated Words and Pictures, from Solar Analytics
The fellow geeks at Solar Analytics also were keen enough to run their own analysis of the data set – and presented the following two trends with permission to include in this WattClarity® article.
Firstly there’s an aggregate view that shows a voltage spike in the five seconds to ~03:58:25 …
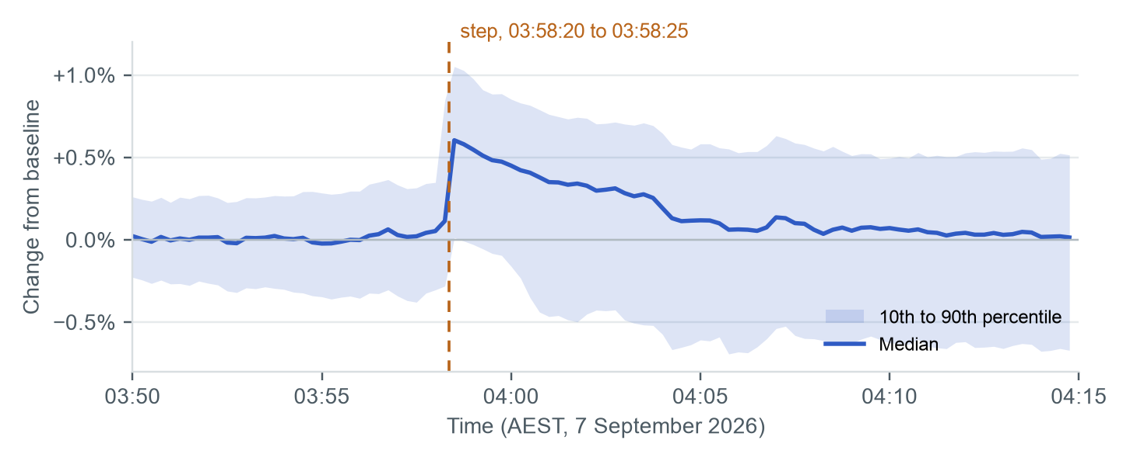
Solar Analytics labelled this:
‘Median change in supply voltage across about 840 CATCH Power sites, 5-second intervals, 03:50 to 04:15 AEST. Shaded band spans the 10th to 90th percentile of sites. Baseline is each site’s median voltage from 03:40 to 03:56.’
… which is something that puzzled us, given we’d heard elsewhere of a significant voltage dip.
In discussion with these same geeks, they did further number crunching and produced the following:
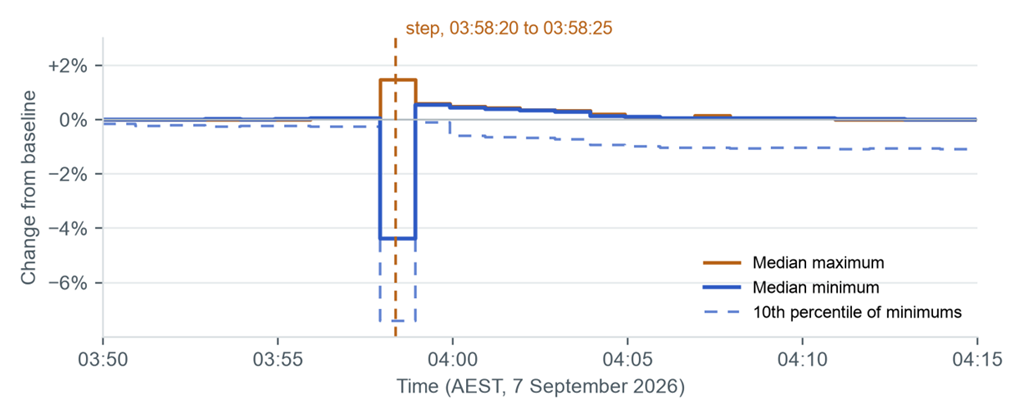
Solar Analytics labelled this:
‘Median change in Watt Watcher 250 ms minimum and maximum voltage across about 890 sites, one-minute intervals, 03:50 to 04:15 AEST. Each step covers the minute ending at its time stamp, for example 03:57:55 to 03:58:55. The dashed line is the 10th percentile of minimums. Baseline is each site’s median minimum or maximum from 03:40 to 03:56. This data places the dip within that minute but cannot time it more precisely.’
In conjunction with the above charts, the team at Solar Analytics have included the following description – which I thought would be useful to include here for readers (with my formatting added):
‘Solar Analytics monitoring across Victoria recorded a brief statewide dip in household supply voltage and a sudden, simultaneous rise between 03:58:20 and 03:58:25 AEST, with a small frequency dip at the same moment. The dip lasted less than about 5 seconds with a median depth of 4.4%; the rise was about 0.6% and had largely cleared by about 04:06.’
… and …
‘What the fleet saw
• One step, everywhere at once. Between 03:58:20 and 03:58:25 the median CATCH site moved from 0.0% to +0.6% of its own baseline voltage. CATCH circuits more than 1% above their own baseline went from under 10 to about 155 within that single 5-second interval.
• A brief, statewide dip in the same minute. Watt Watcher 250 ms minimums for the minute to 03:58:55 fell a median 4.4% (about 10.5 V) below each site’s baseline, and one site in ten fell 7.4% or more. 773 of 867 sites dipped by more than 1%, and 40 touched below 216 V. CATCH readings every 5 seconds show no dip, so it lasted less than about 5 seconds. It was deepest in inner Melbourne (median −6.0% CitiPower, −5.3% United Energy, −5.2% Jemena) and shallowest on Powercor (−2.6%).
• Every Victorian network was affected. Median rises ranged from +0.41% (Powercor) to +0.68% (Jemena, CitiPower). A step this uniform across all five networks points to a transmission or system-level cause, not a local distribution fault.
• Frequency dipped at the same moment. Mean reported frequency fell from about 50.00 Hz to 49.96 Hz as the voltage rose, stayed near 49.97 to 49.98 Hz for more than ten minutes before returning to about 50.00 Hz at 04:16.
• Few sites left the normal range for more than a moment. On one-minute averages, sites above 253 V (230 V +10%) rose from 12 to 27 for three minutes, and no site averaged below 216 V (230 V −6%) in any minute between 03:30 and 04:30. Readings below 216 V were confined to the brief dip.
• No sign of widespread loss of supply. Only 3 of about 1,750 reporting sites were silent for the whole 03:58 to 04:02 window.
• The lowest and highest points. The deepest 250 ms minimums were 201.5 V and 205.9 V at two inner Melbourne sites (postcodes 3104, 3101). In the same minute the median 250 ms maximum was +1.5%, above the +0.6% level voltage settled at, which suggests a brief overshoot as voltage recovered. Two neighbouring AusNet sites (3753, 3757) that were already near 254 V touched 260.4 V and 260.5 V.’
Describing the data, Solar Analytics noted this:
‘the Global-Roam VIC live metrology extract for local day 7 September 2026 (4,686 sites). About 1,750 sites were reporting voltage around 04:00: roughly 850 CATCH Power devices and 900 Watt Watcher devices.
1) CATCH Power reports a spot voltage and frequency about every 5 seconds, so dips shorter than that can be missed; second-level timing comes from these devices.
2) Watt Watcher devices report on a 60-second interval. Most Watt Watcher circuits report voltage as the minimum and maximum over that interval, which the manufacturer advises are sampled at 250 ms, together with their midpoint (vmean); a small number report a single voltage value instead. Where voltage is blank, this analysis uses vmean. Readings outside 150 to 300 V were excluded. Per-site voltage is the median across that site’s circuits.
The brief dip appears only in the Watt Watcher minimums and maximums; CATCH spot readings every 5 seconds do not capture it.
These are household meter readings, not network measurements, so they reflect the monitored sample rather than every connection. The data does not identify the cause; AEMO market notices and incident reports for 03:58 AEST on 7 September 2026 are the place to confirm it.’
Internal analysis
Internally (from us here at Global-Roam Pty Ltd), we’ve taken the same source data set from Solar Analytics and prepared the following (much busier) image that separates out voltage effects by postcodes (as identified by Solar Analytics in the data set delivered):
Click on the image to download a larger version.
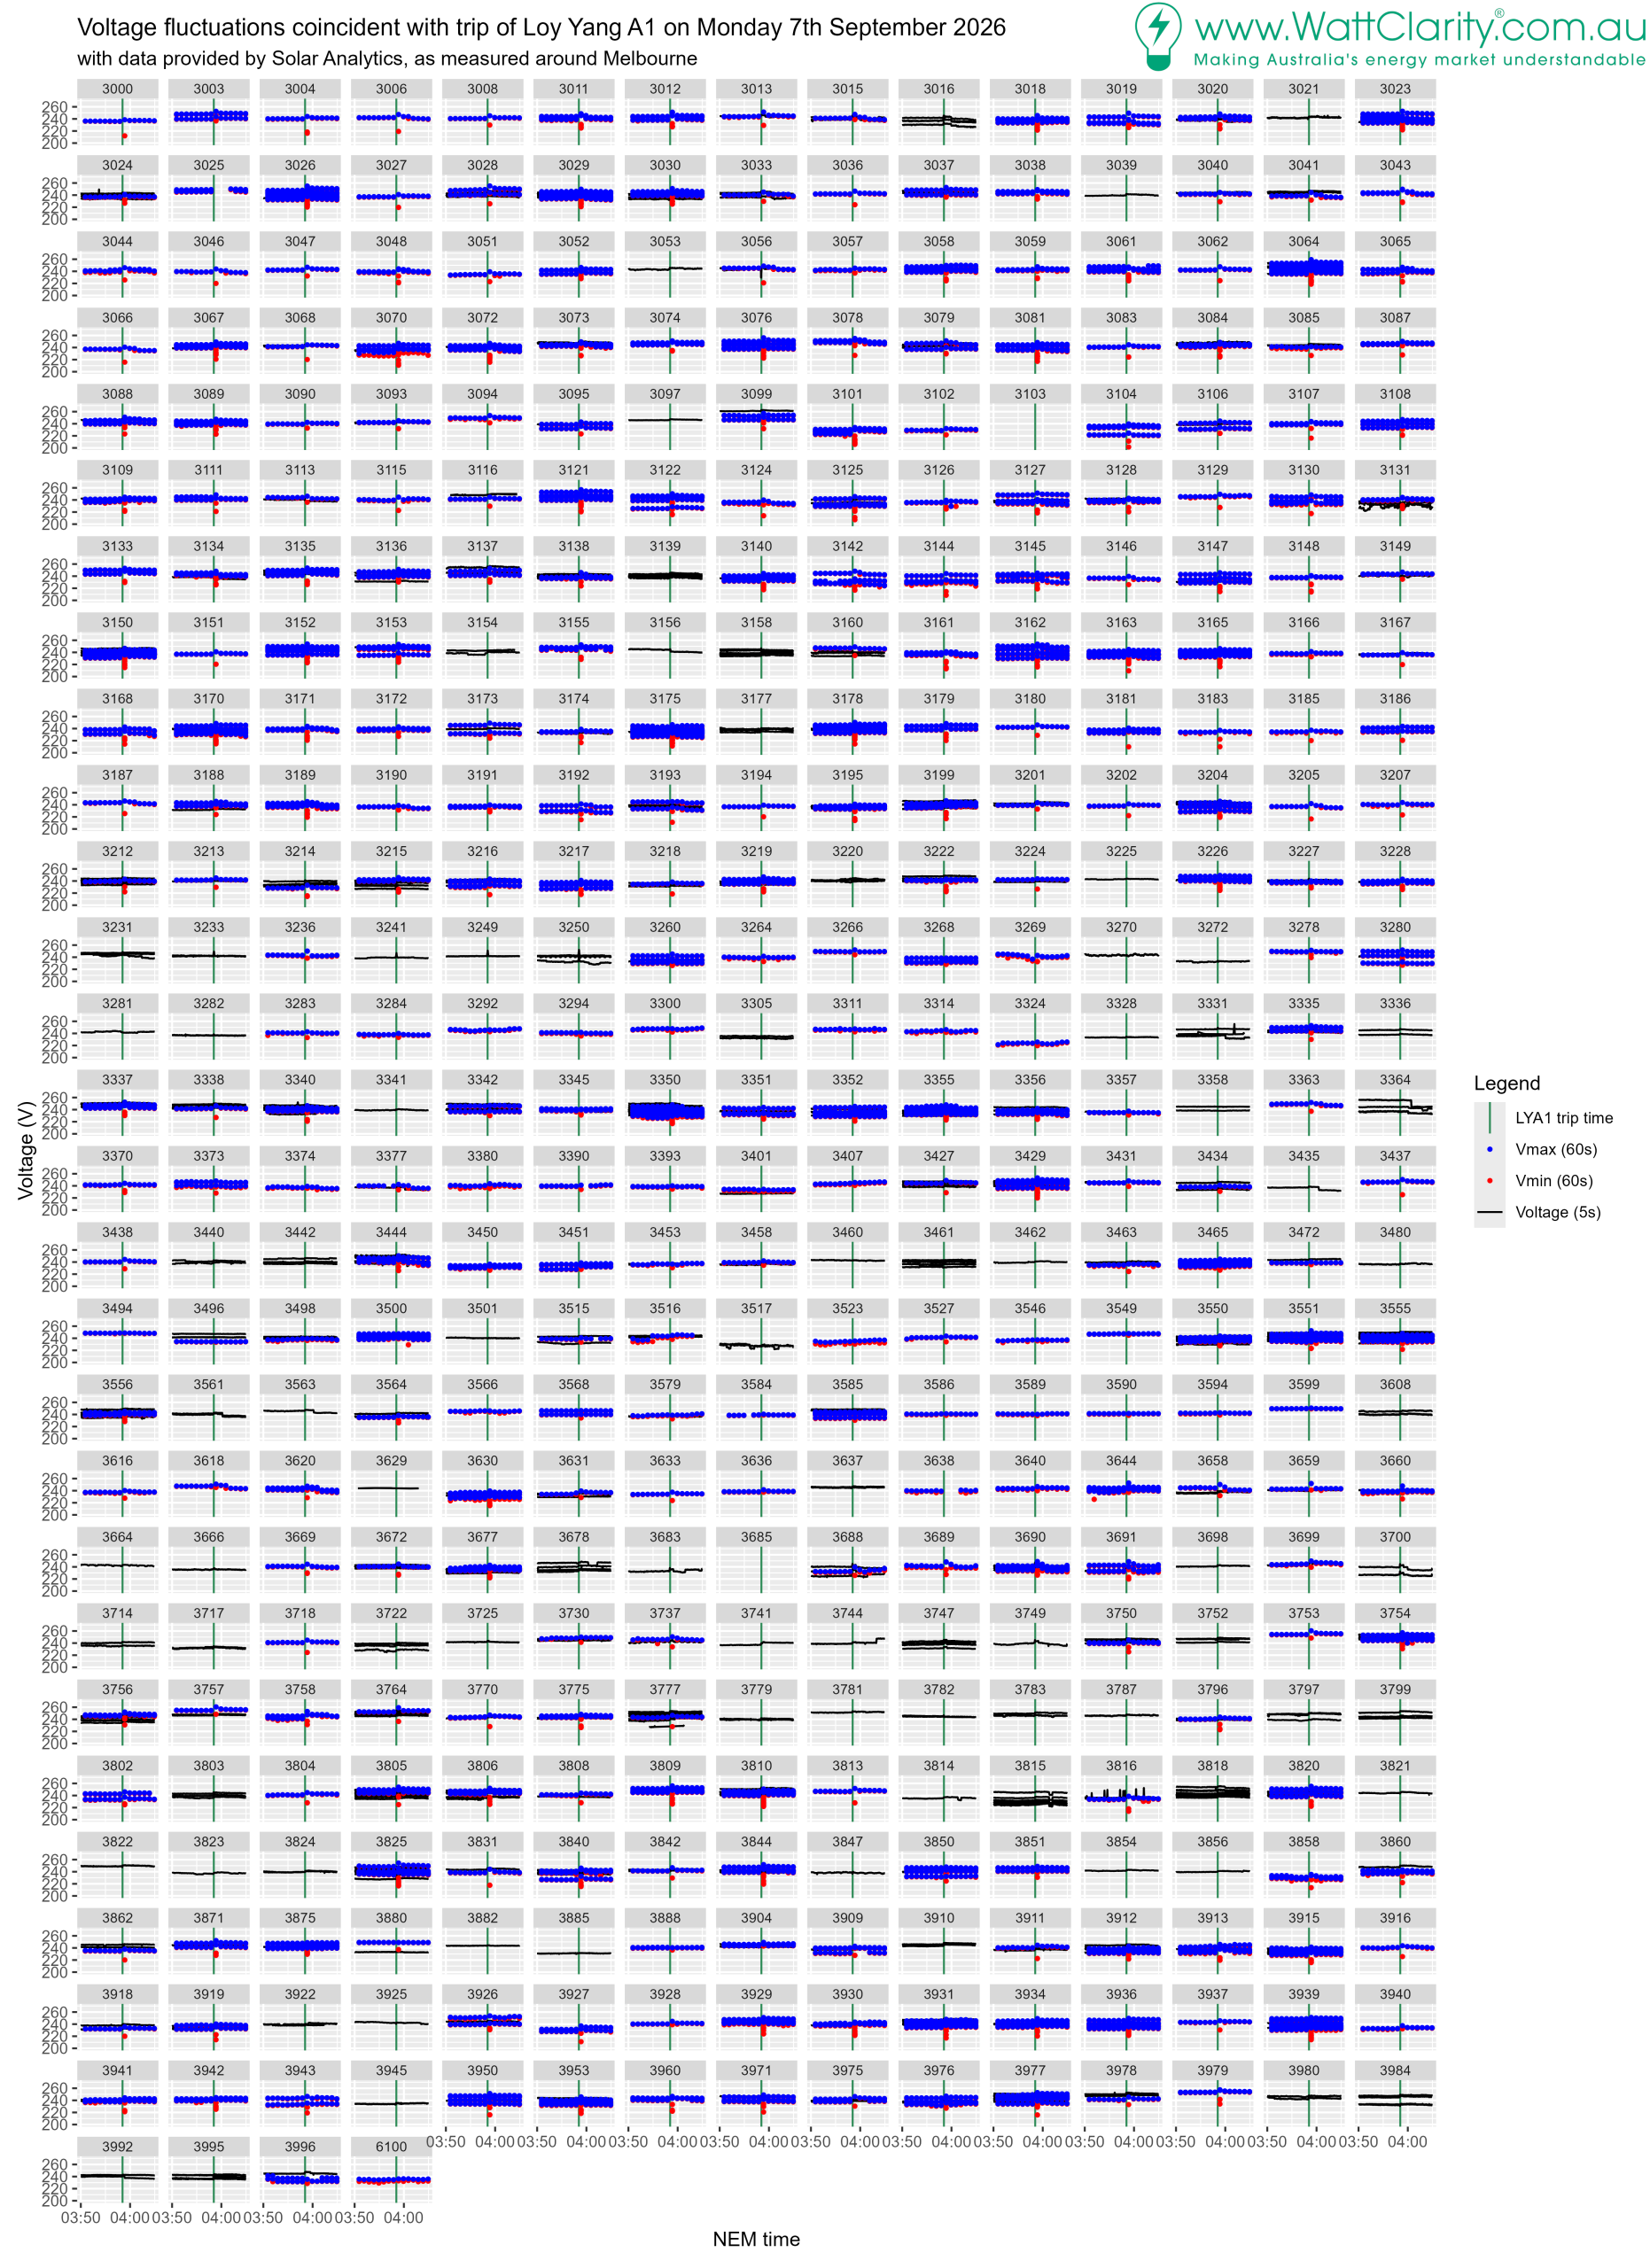
This helps explain that:
1) Some devices captured a shorter-term (but larger) dip in voltage;
2) Whilst many of them captured a longer-cadence rise in voltage which (we’re hypothesising, at this point) followed on, as the network compensated.
Elsewhere…
If you know of other sources we might be able to access, to delve further, please let us know?
Questions?
Whilst the above goes some way of providing a richer picture, there are still unresolved questions – such as:
1) the cause of the unit outage at Loy Yang A1, and any implications for the unit:
(a) remembering the initial rebid reason noted ‘investigation to follow’);
(b) and that the short unplanned outage that followed coincidentally ran into a longer planned outage that was to start anyway, on 25th September 2026;
2) a more precise sequence of events (not just onsite at Loy Yang A … but out in the broader network); and
3) an explanation (given it’s not my forte) of how a unit trip propagated into a voltage fluctuation throughout the network … or if that’s putting the chicken before the egg?
If there are more learned readers out there who can help explain, I’d be very interested to hear?

Be the first to comment on "A voltage dip (and a spike) in Victoria (coincident with the trip of Loy Yang A1) at 03:58 on 7th September 2026"