

The weather-induced outcomes that transpired this week on Monday 18th May 2026 have struck a chord with a number of NEM (analysts and) stakeholders.
1) We’ve already shared two articles about these events:
(a) On Tuesday morning we wrote ‘The absence of the ‘duck curve’ on Monday 18th May 2026 stands out, in recent history’;
(b) That followed the brief note ‘A snapshot of the generation mix across the NEM, on Monday morning 18th May 2026’ on Monday.
2) But we’ve seen a range of other comments raised:
(a) We saw that David Osmond wrote the following:
‘This week had 2 very challenging nights with up to 8 GW of ‘Other’ required on 18 May. This isn’t far short of the record 10.2 GW set on 12 June 2025.
It was the 6th most challenging day of the simulation, and the earliest in the year requiring this level of ‘Other’.’
… in his update on LinkedIn on Wednesday.
(b) And Weije Mak wrote:
‘18 May 2026 — #batteries running textbook trading strategies could have lost money on one of the highest-priced days of the month in the #NEM.’
… in his LinkedIn update also on Wednesday
I wondered … so, with the ‘Bids & Offers’ widget from ez2view (upgraded to v9.18 this week) I thought I would take a ‘before’ and ‘after’ look at aggregate bidding and dispatch of all of the units we’ve classified as ‘gas’ using the ‘Quick filters’ in the software.
Prior to the day unfolding
Because of the cadence of the NEM dispatch intervals and market day cycles, we start with this snapshot time-travelled back to the 04:05 dispatch interval (i.e. first of Market day), with:
1) A look-back set to zero;
2) But the look-forward able to view forward through the 287 dispatch intervals remaining in that day,
… which provides visibility of the expectations (at that time) of how the bid stack (and dispatch) for gas-fired generation would unfold through the remaining intervals in that day:
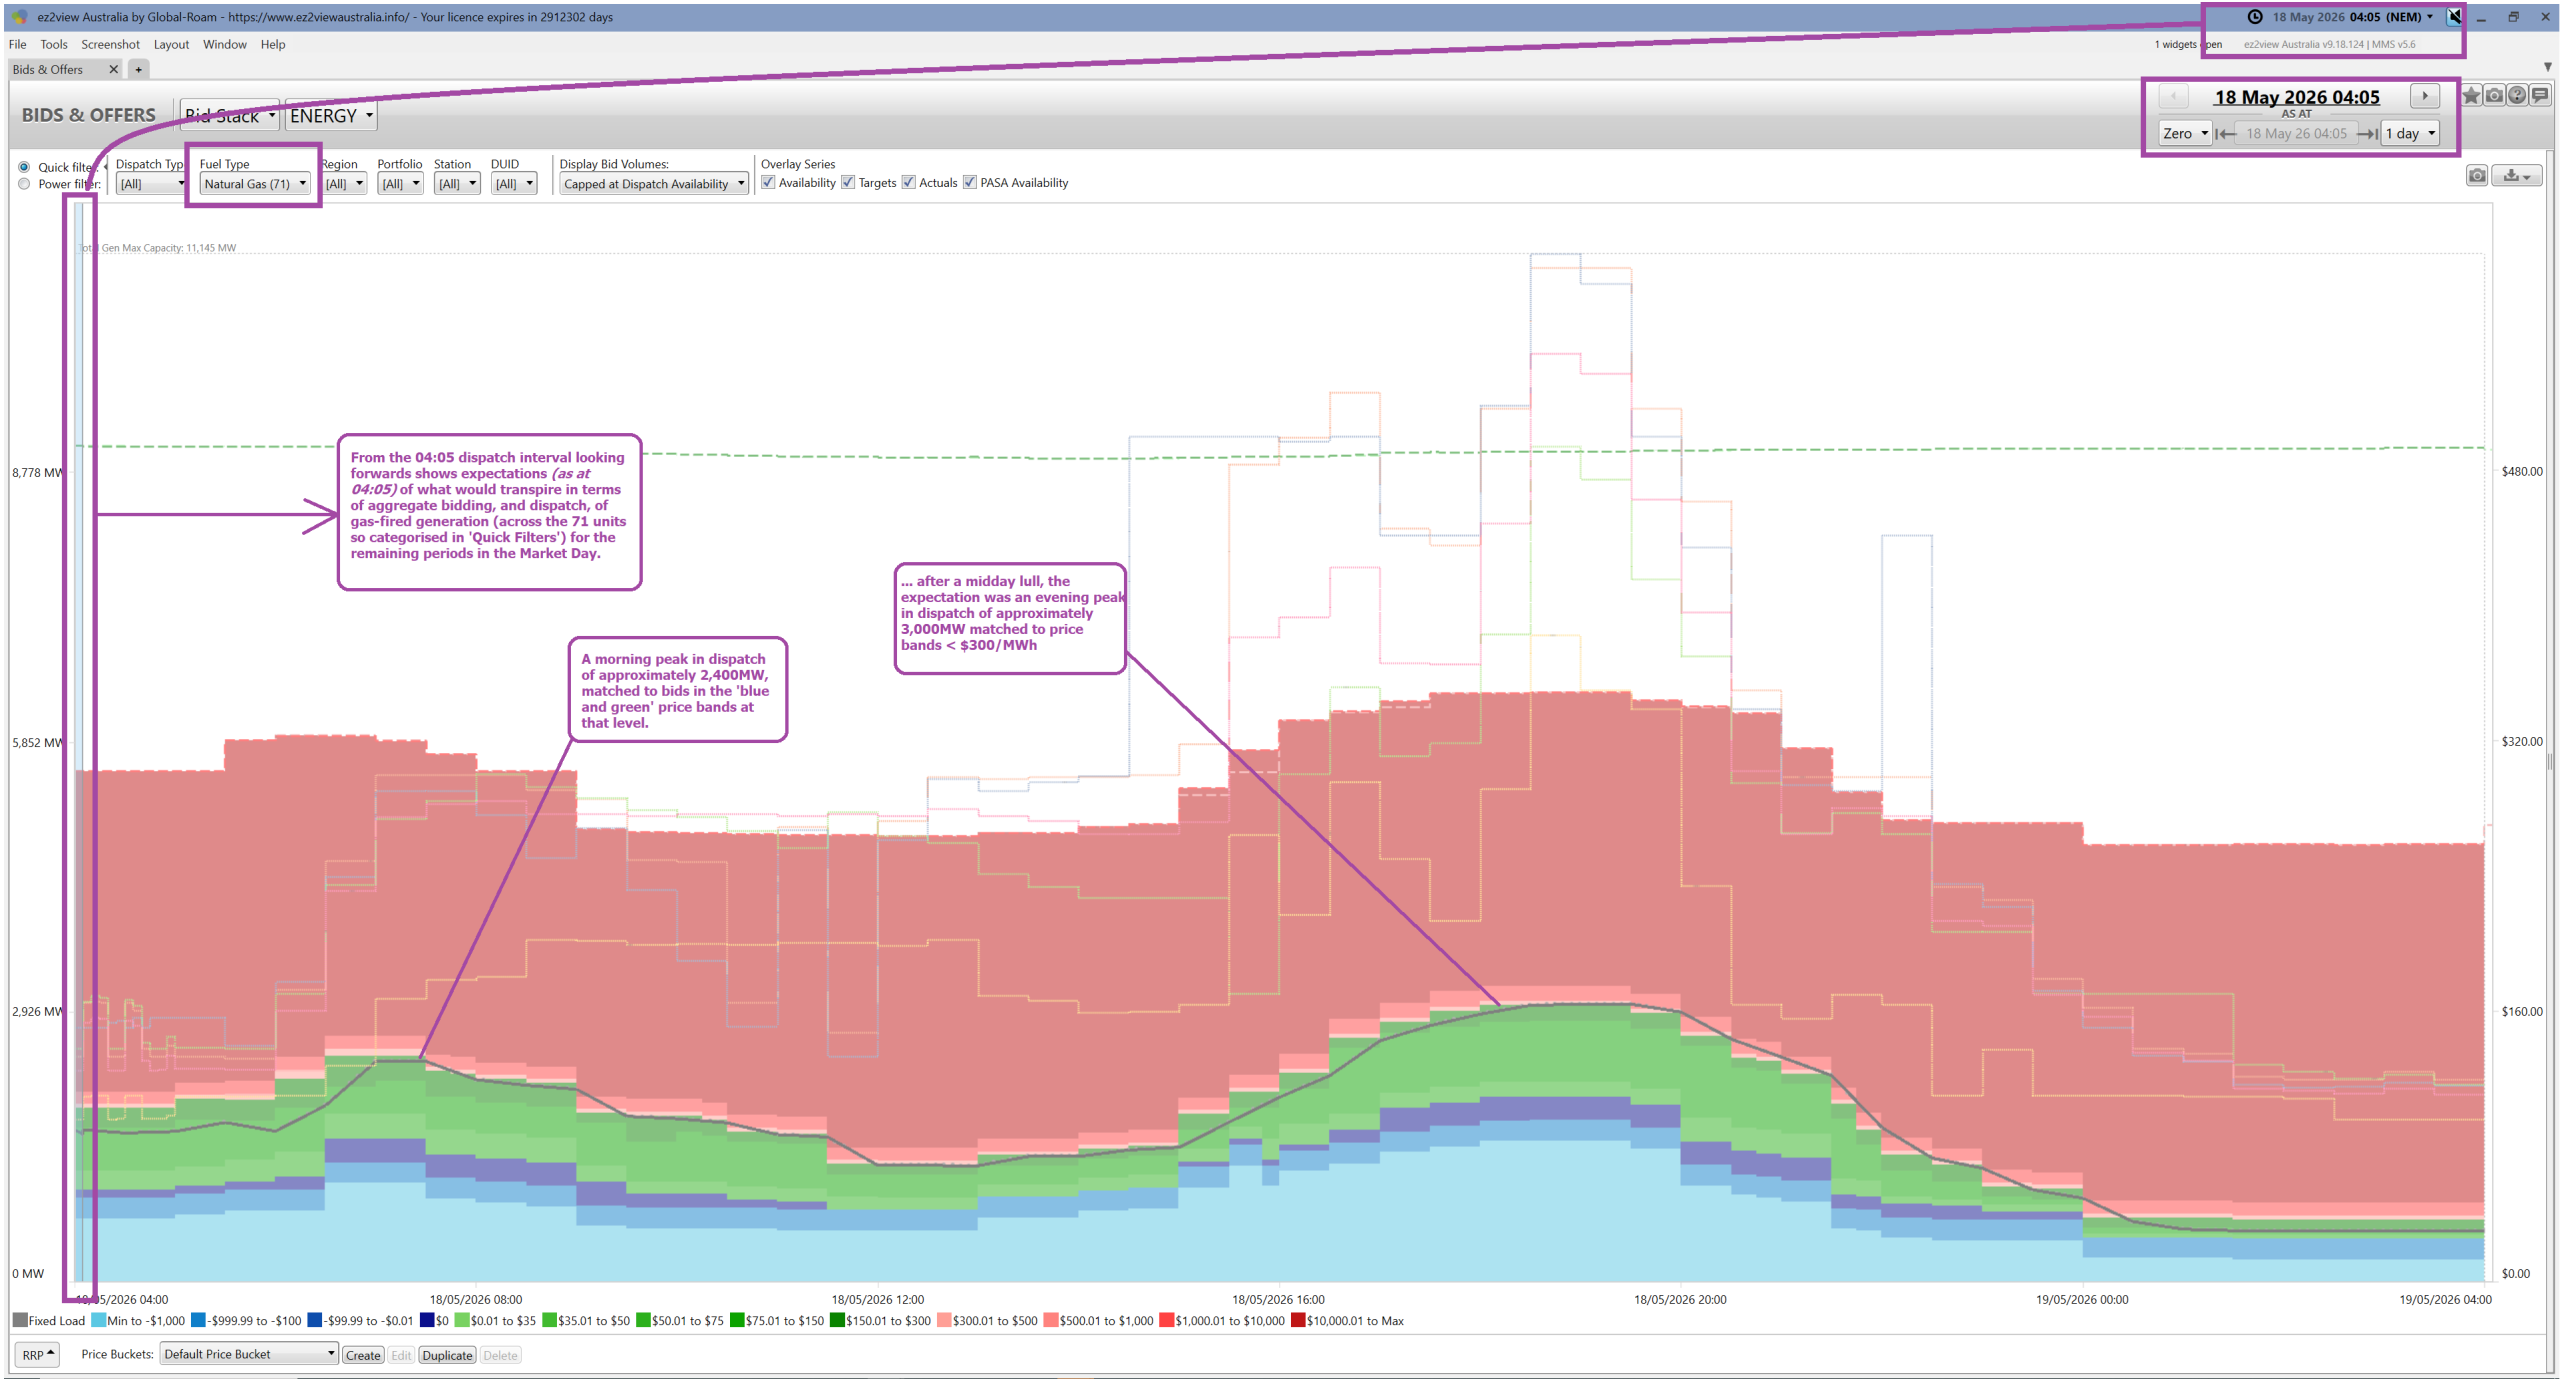
As noted on the image, there appears three distinct phases through the day in terms of expectations at the start of the day:
1) A morning peak in dispatch at approximately 2,400MW (matched to bidding in the ‘blue and green’ bid bands
2) A middle-of-the-day drop in dispatch from gas
3) but then an afternoon and evening ramp in dispatch (to ~3,000MW) matched to the ramp in prices and the repricing of capacity to cheaper price bands (<=$300/MWh).
What actually unfolded was quite different …
To show what actually unfolded:
- we wind the clock forwards to 24:00 at the end of Monday 18th May 2026
- and swap looking forwards for looking backwards 288 dispatch intervals.
Clearly the picture is quite different:
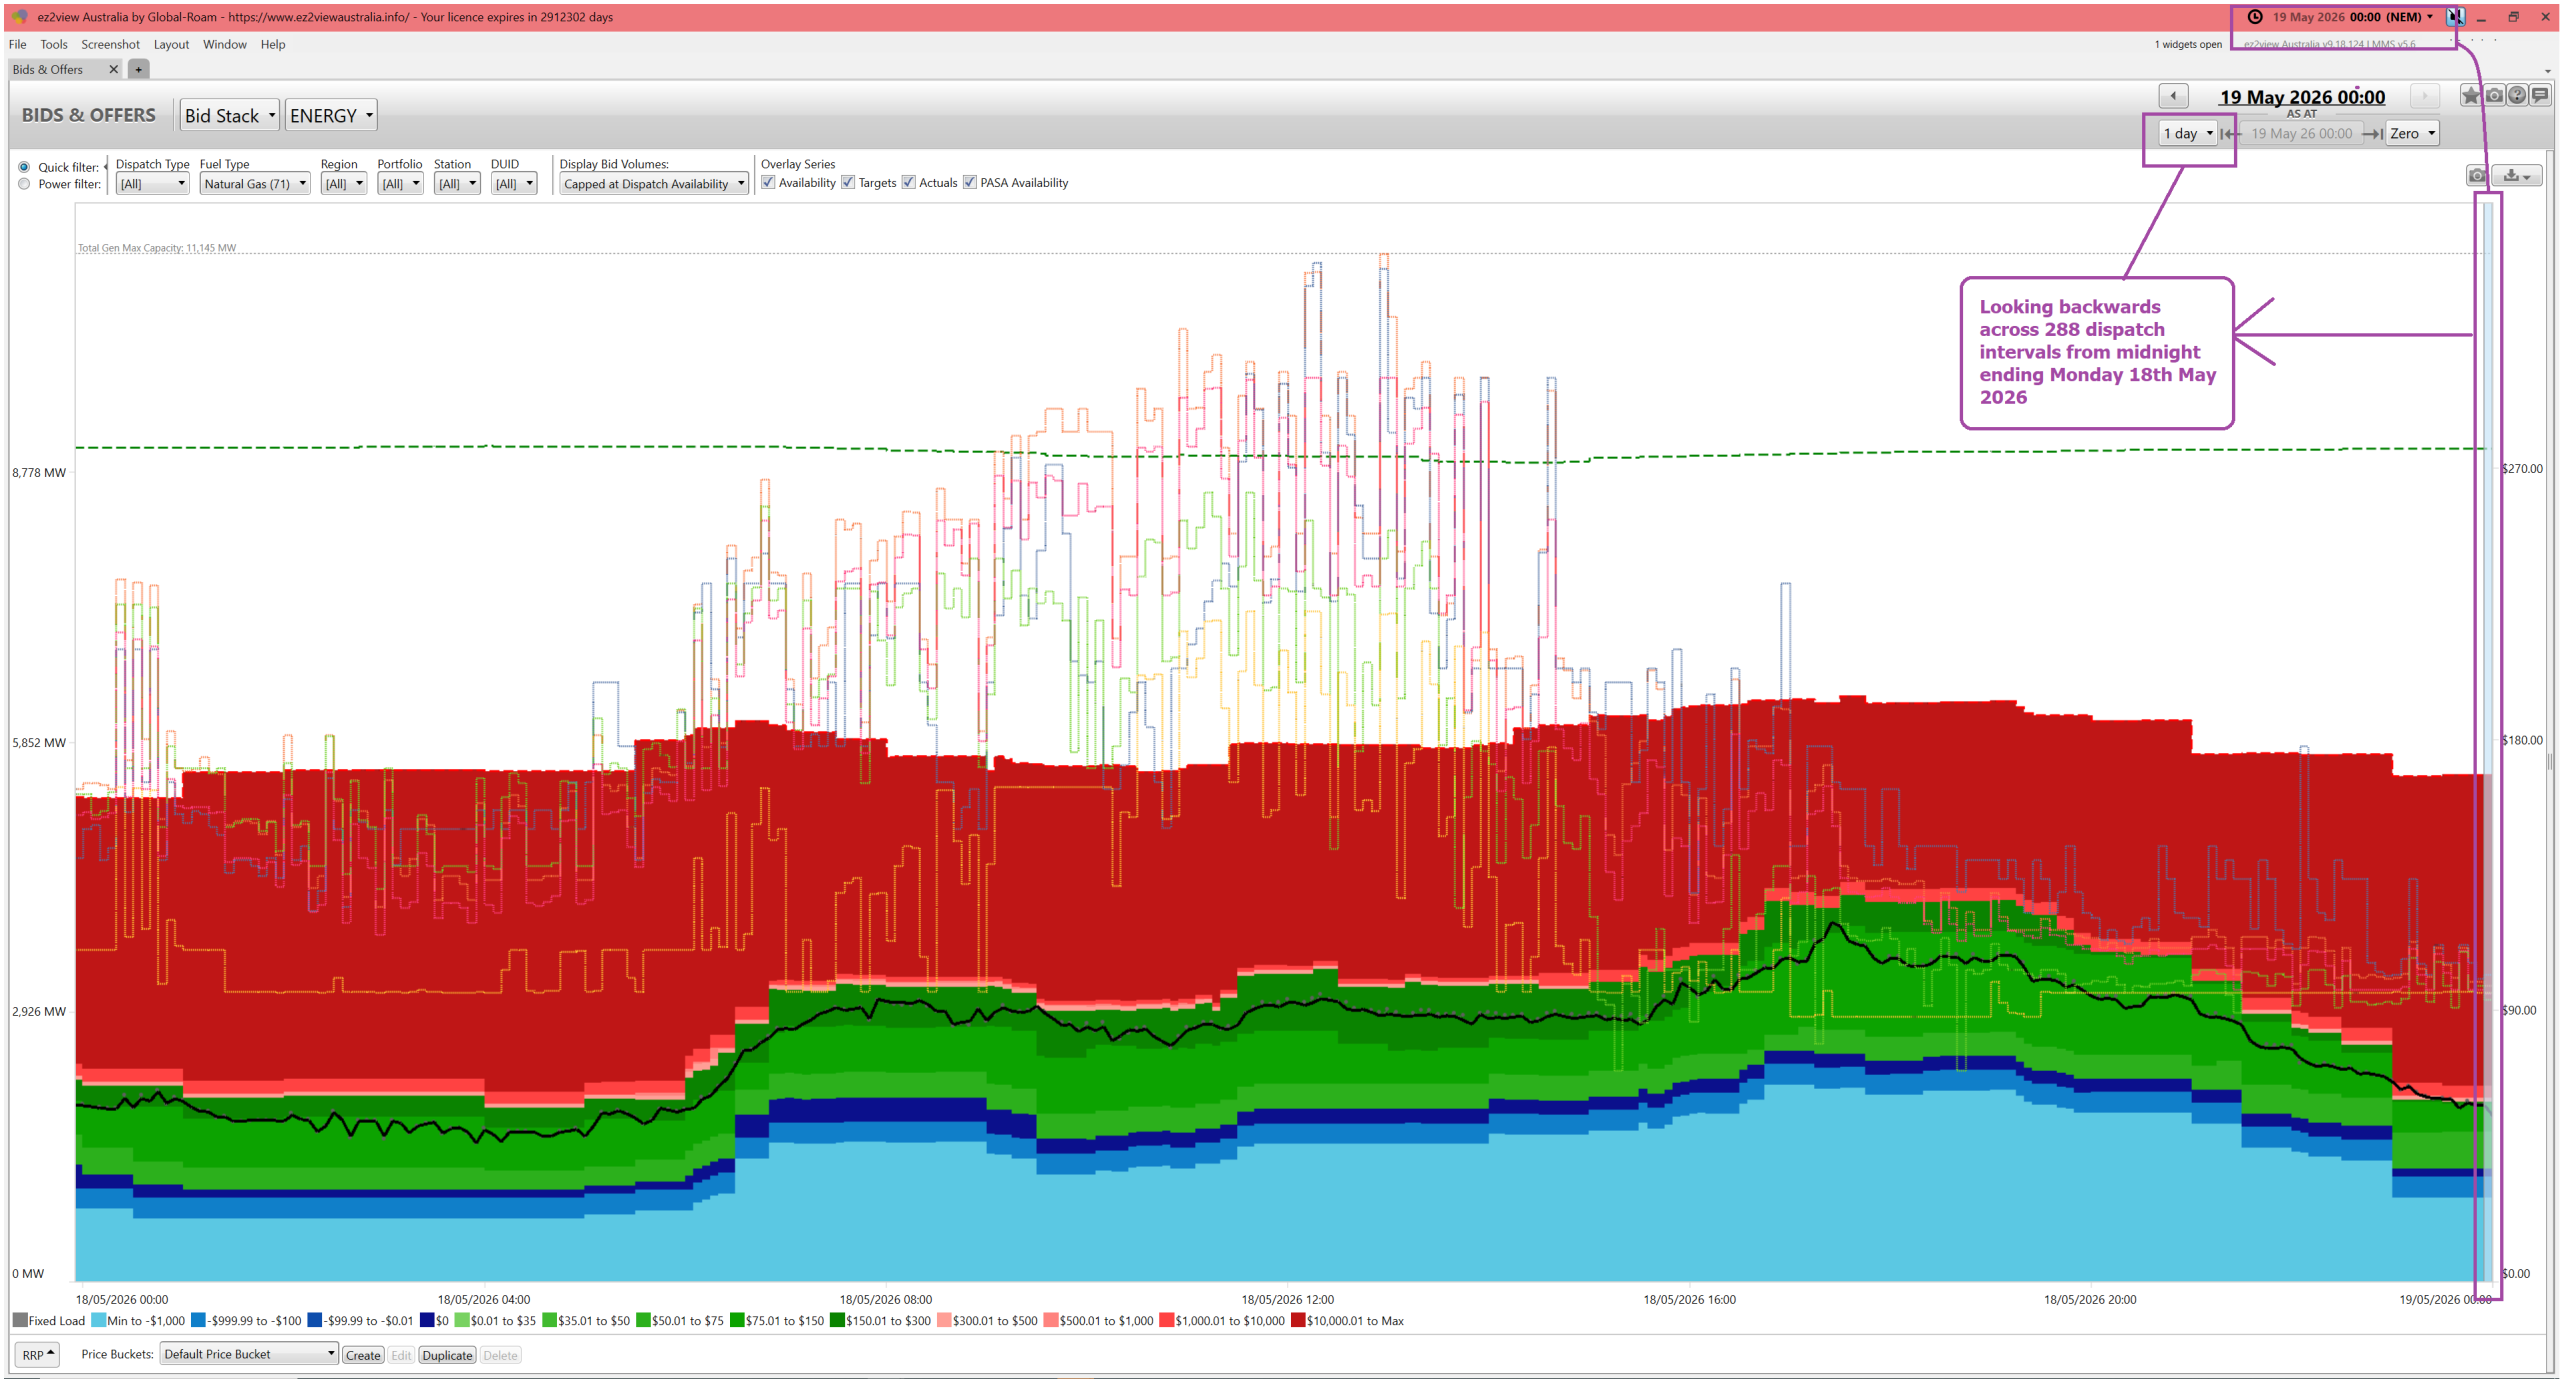
Amongst the differences, we can see:
1) A higher and flatter dispatch shape for the gas-fired generation through the daylight hours:
(a) Approximately 3,000MW through many daylight hours
(b) Peaking at ~3,800MW in the evening
2) This stems from more capacity bid in ‘blue and green’ as a result
3) Whilst prices were elevated through the day, the evening prices were not as high as the expectations held them to be as at 04:05 that morning (i.e. up to ~$600/MWh in QLD and NSW for the evening).
As time permits, we might explore further…

Be the first to comment on "Reviewing Monday 18th May 2026 (gas generation actuals, compared to expectations)"