

The Australian Energy Market Commission is consulting on a pair of rule change proposals concerning contingency frequency control ancillary services (CFCAS) in the NEM. You can read more about them in the original rule change proposals from Mitch O’Neill of Grids (here and here) and in the Commission’s Discussion Paper, but very simply they involve:
- Adjusting quantities of CFCAS procured in the spot market in a way that jointly co-optimises energy and FCAS costs, and
- Modifying cost recovery arrangements for CFCAS to recognise that the system’s larger single generating units and loads tend to drive the quantity and cost of CFCAS procurement.
This post focuses on the second of these proposals, which suggests applying a “runway cost allocation” methodology to CFCAS cost recovery.
What costs are we talking about?
In every dispatch interval, as well as dispatching generators and loads in the energy market, AEMO procures FCAS quantities across 10 separate services, which contribute to maintaining frequency stability and hence system security.
There are two Regulation services (one for raising and one for lowering frequency) which operate more or less continuously to help “steer” system frequency towards 50 Hz if it drifts due to small changes in supply-demand balance.
The other eight services act only after a “contingency” (think of a generator tripping) which suddenly shocks the frequency outside its normal operating range (for the mainland, a change of more than +/- 0.3 per cent). These services cover 4 distinct timeframes from 1 second to up to 10 minutes, split into raise and lower pairs, making 8 CFCAS services in total.
Many generators and loads are capable of providing at least some of these FCAS capabilities, and offer these in quantity-price bands very similar in structure to the energy market bidding arrangements. AEMO determines a total quantity requirement for each service; the market dispatch process then selects providers and sets an enablement price based on marginal offer costs.
The quantities of CFCAS procured in each interval generally depend on the size of the largest contingency which is credible at that time. Often this is driven by the output or consumption level of the system’s largest generator or load, since a trip of this generator or load may represent the largest credible shock to the system supply-demand balance.
The total cost for each service in an interval is just its market price multiplied by the quantity procured; in total this is what AEMO pays the selected service providers.
Across a year, CFCAS costs would generally amount to less than 1 per cent of the value of energy purchased through the NEM spot market, or something of the order of $100 million annually.
Note – in practice the determination of CFCAS requirements and allocation of costs can be more complex than outlined here and in the following analysis, particularly when region-specific FCAS requirements cause prices to diverge between NEM regions. The purpose of this post is to broadly explain CFCAS cost recovery principles and how runway allocation would vary these, not to estimate actual outcomes under a runway allocation regime.
Cost allocation
For each dispatch interval, CFCAS costs are currently recovered from generators (for the 4 raise services) and market customers (for the 4 lower services) in proportion to their shares of total generation and total load for that interval. So a generator providing 1 per cent of the total generation dispatched in an interval will bear 1 per cent of that interval’s raise CFCAS costs.
The general logic for this is that the need for raise CFCAS arises from the risk of generators tripping so generators should bear costs of the raise services, and the need for lower CFCAS from the risk of loads suddenly going offline, hence costs for the lower services are allocated to customers.
While straightforward, arguably this allocation doesn’t reflect the volume drivers of these services, which are generally the largest single contingencies needing to be covered, not total generation and load.
Under the current approach, four generators each producing 100 MW would as a group pay the same share of raise CFCAS costs as one generator producing 400 MW, but it’s the large generator that is principally driving the volume – and hence cost – of raise CFCAS that AEMO needs to enable in that interval.
Were this generator not operating, with the next largest contingency being a trip of a 100 MW unit, AEMO’s raise CFCAS volume requirement would be much smaller than needed to cover loss of the 400 MW unit.
This doesn’t mean it would be appropriate to recover all the raise CFCAS costs in this interval from the single largest generator: in its absence, a smaller quantity of raise services would still be required. This is where the idea of runway cost allocation arises.
Runway cost allocation – a plane example
Imagine we need to build an airport runway that will be used by four smaller aircraft and one large plane once per day. The small planes only need a runway 1km long but the large plane needs 2km to land safely. We’re trying to work out an equitable daily usage charge, recognising that all the planes use the runway, but that its second kilometre has been built solely to cover the large plane’s needs.
We might come up with the following approach:
- Work out the total daily charge we need to recover for the runway as a whole
- Allocate half of this (representing the first kilometre of runway) equally to all the planes using it daily: the four small ones and the one large one, then
- Allocate the other half (the second kilometre) entirely to the large plane, the only aircraft that requires it.
Graphically we can visualise the approach like this:
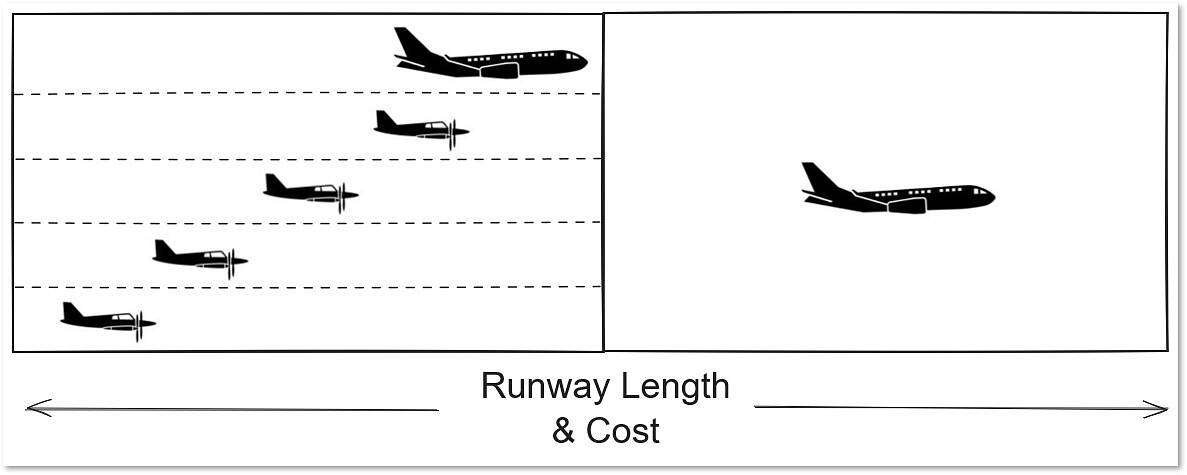
The area of each rectangular “tile” on this schematic becomes that plane’s cost share for the relevant section of runway, so each of the four small planes pays one-fifth of half the total daily cost – ie a 10 per cent share of total costs – while the large plane gets a 60 per cent share made up of its one-fifth share of the first kilometre and all of the costs of the second kilometre. (We’re implicitly assuming a constant cost per kilometre to build and maintain the runway).
That’s runway cost allocation in a nutshell. Applying the idea to CFCAS costs in the NEM, the rule change proposal gives the example below for five generators with outputs ranging from 45 MW to 300 MW. Here the “runway length” is the volume of raise CFCAS required – and we assume this requirement is driven by the output level of the largest unit (“the big plane”).
The tile areas in each column of the figure (0-45 MW, 45-65 MW etc) show the allocation of costs to those generators which would need at least that column’s CFCAS volume (section of runway) to cover their risk of tripping. The smallest generator E gets a share of the first column only, the largest A gets an increasing share in each higher range, including 100% of the final 200-300 MW column, driven entirely by its output exceeding the next largest generator B.
The cost shares under runway allocation are then proportional to the sum of tile areas for each generator – a single tile for generator E, five separate tiles for generator A.
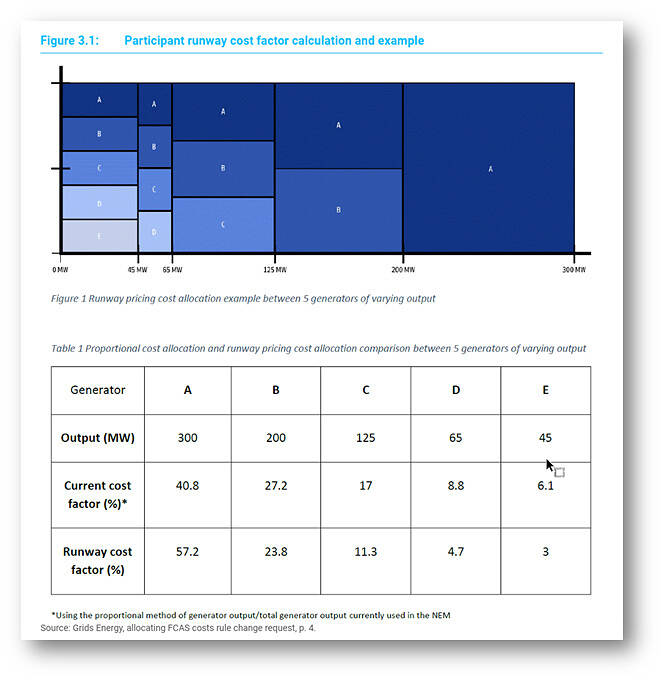
The table compares the resulting runway cost shares with the current proportional method, showing that the largest generator would pick up a larger share of CFCAS costs than under simple proportioning, while smaller generators would all incur lower shares.
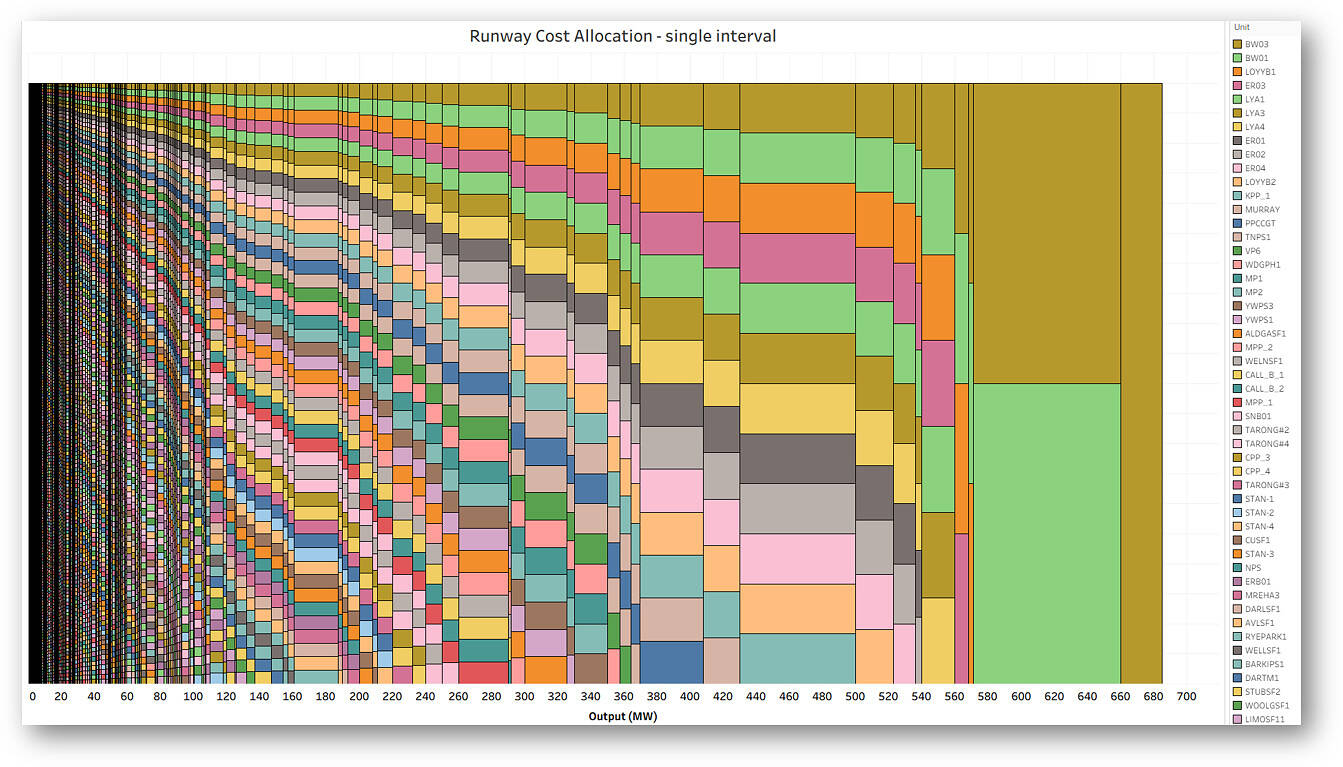
Runway allocation – some NEM data
In the NEM, with hundreds of generators producing widely different amounts of output in each interval, from a handful of megawatts up to nearly a thousand, coming up with runway allocation shares for every dispatch interval might seem daunting, but fortunately we have computers. Here’s an example for a recent randomly picked interval where Bayswater 3 at 685 MW was the largest single source of output:
These are the resulting share factors under runway and proportional allocation for the units with highest output in this interval:
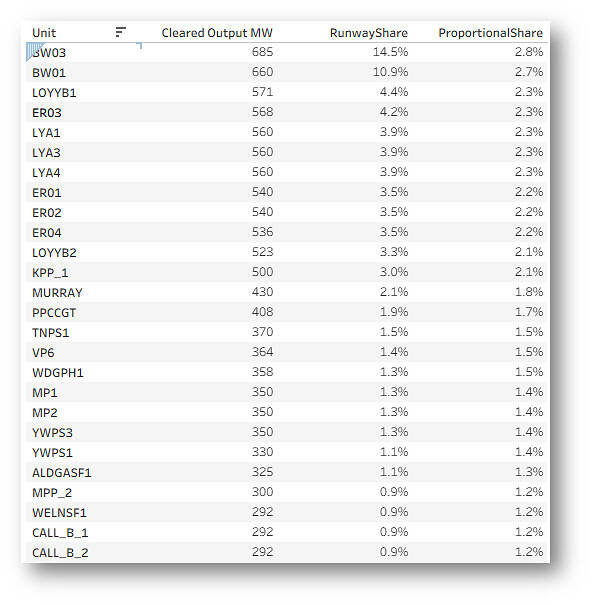
As expected, the runway method allocates a significantly larger share factor to the units with highest output, with the top 8 receiving an aggregate of just under 50 per cent. After the the top 20 or so units, runway shares are noticeably lower than under proportional allocation.
To get a sense of overall effects, the next chart shows share factors under proportional and runway allocation, averaged for all intervals since 1 July this year and grouped at power station level, together with the ratios of these averages.

Larger stations whose shares would vary significantly between the two approaches are identified in the top panel. Unsurprisingly, stations with relatively large unit sizes (Kogan Creek with a single 750 MW unit, and New South Wales and Victorian stations with units capable of 500 – 700 MW) would attract higher share factors under runway allocation, while stations with moderate unit sizes (Gladstone 6 x 280 MW, Stanwell 4 x 350 MW) would see lower shares.
At smaller generator sizes, the ratio plot shows that runway allocation would yield greatly reduced share factors, typically 2 to 6 times smaller than the current proportional allocation method.
Practical issues – any debris on the runway?
While it might look complex at first, implementation of runway cost allocation wouldn’t be technically difficult. This mechanism is already used in Western Australia’s Wholesale Energy Market for allocating the costs of ‘spinning reserve’ (a form of contingency FCAS), based unit output relativities. In the NEM, much more complex mechanisms are already used to allocate and recover the costs of Regulation FCAS.
But there are some other important considerations which this short post can’t address in any detail:
- load side contingencies and lower CFCAS allocation: unlike the generation side of the market, the load side comprises a relatively small number of discrete scheduled loads – many of which operate intermittently, eg hydro pumps or recharging batteries – a few very large and constantly running non-scheduled loads like aluminium smelter potlines, and a very large number of (relatively) tiny loads supplied in aggregate by market customers (retailers). In principle, runway allocation could be applied for allocating lower CFCAS costs, and this approach is suggested in the rule change proposal. However it is not entirely clear how, or if, this would be applied to the large but diverse loads of market customers who don’t impose any specific contingency size requirement on the procurement of lower CFCAS.
- multiple generator contingencies – the volume of raise contingency services procured is sometimes driven by the risk of multiple generators tripping simultaneously, which may be a credible event when they are part of a specific network protection scheme. Ideally this combined set of generators would be treated as a single large unit for the purposes of runway cost allocation. This would add some complexity to its implementation.
- network-driven contingency sizes – CFCAS procurement sometimes takes into account network contingencies such as the credible risk of an interconnector trip leading to separation of a region from the rest of the NEM. In these circumstances the level of flow on the interconnector, rather than a generator or load output level, can determine the volume of CFCAS procurement. It is not clear if and how this would be dealt with under runway allocation, eg could network elements enter the runway allocation methodology in these cases, with a share of costs allocated to network owners?
- net benefits – ultimately, a decision to change the cost recovery approach for CFCAS depends on whether it better meets the National Electricity Objective to “promote efficient investment in, and efficient operation and use of, electricity services for the long term interests of consumers of electricity”. Whilst fairness in the allocation of costs to participants – eg not overcharging smaller generators and loads for costs predominantly driven by large discrete entities – might also seem important, whether or not a rule change proposal succeeds will depend more on its efficiency.
The rule change proposals and discussion paper outline a number of possible efficiency impacts that the Commission will have to weigh against the costs of implementing any change (and the inevitable counter-arguments from any disadvantaged stakeholders). Submissions on the discussion paper are due on Thursday December 18th.
=================================================================================================
About our Guest Author
 |
Allan O’Neil has worked in Australia’s wholesale energy markets since their creation in the mid-1990’s, in trading, risk management, forecasting and analytical roles with major NEM electricity and gas retail and generation companies.
He is now an independent energy markets consultant, working with clients on projects across a spectrum of wholesale, retail, electricity and gas issues. You can view Allan’s LinkedIn profile here. Allan will be occasionally reviewing market events here on WattClarity Allan has also begun providing an on-site educational service covering how spot prices are set in the NEM, and other important aspects of the physical electricity market – further details here. |
Dear Allan,
Regarding multiple generator contingencies, how do you suppose this will be implemented? Would a second layer of runway pricing be implemented from within the tripping scheme? My brain hurts trying to think about what a fair scenario would be.
Also, curious how the cost recovery for DPV tripping would be handled https://www.aemo.com.au/initiatives/major-programs/nem-distributed-energy-resources-der-program/managing-distributed-energy-resources-in-operations/der-behaviour-during-disturbances
Thanks for a great article as usual