
Editor’s Note: David has adapted this article from a presentation he gave at the All-Energy conference in Melbourne on Wednesday, 19th October 2025. Paul has already shared some of the insights from David’s talk.
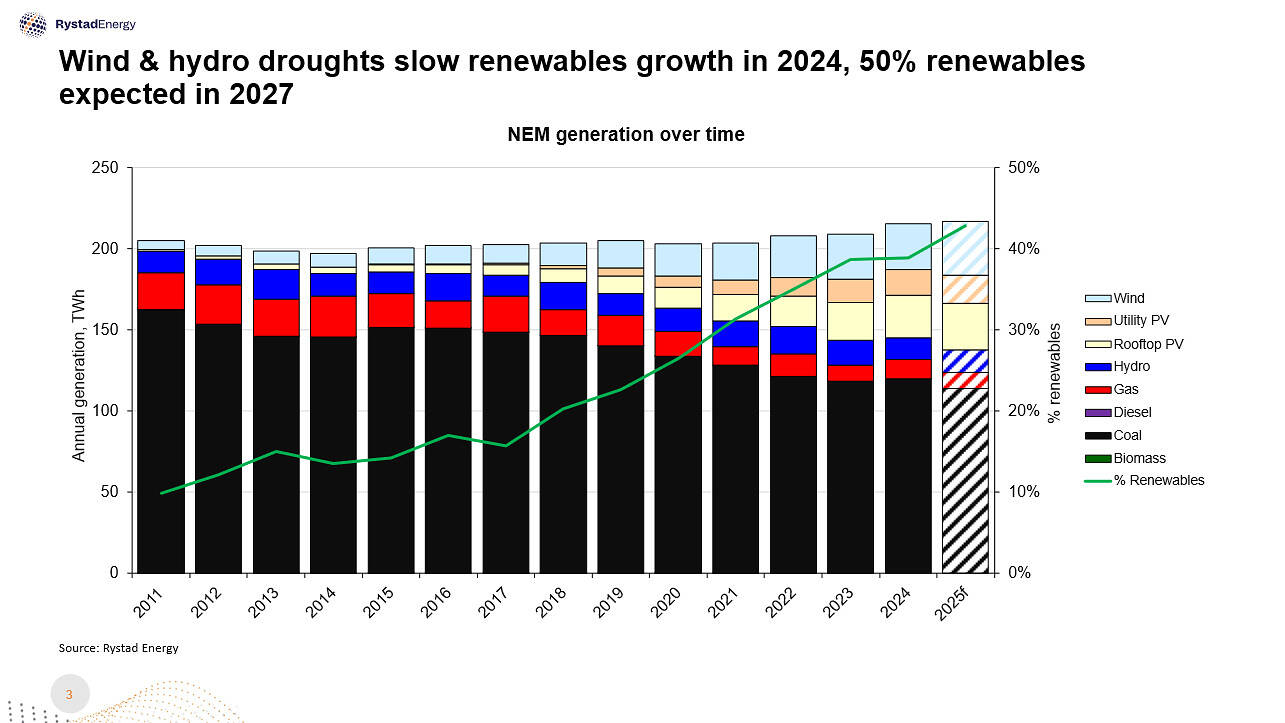
Australia’s National Electricity Market (NEM) is on track to reach 42-43% renewables in 2025 and more than 50% renewables in 2027, simply based on what is under construction and commissioning, as well as activity in the Australian household (PV+Batteries). The pace of transition to a predominately solar and wind grid is occurring quickly, only 8 years ago (2017) the total renewables generation was less than 16% of total annual generation, with the nation having a target of 82% by 2030.
The NEM dynamics are about to change dramatically
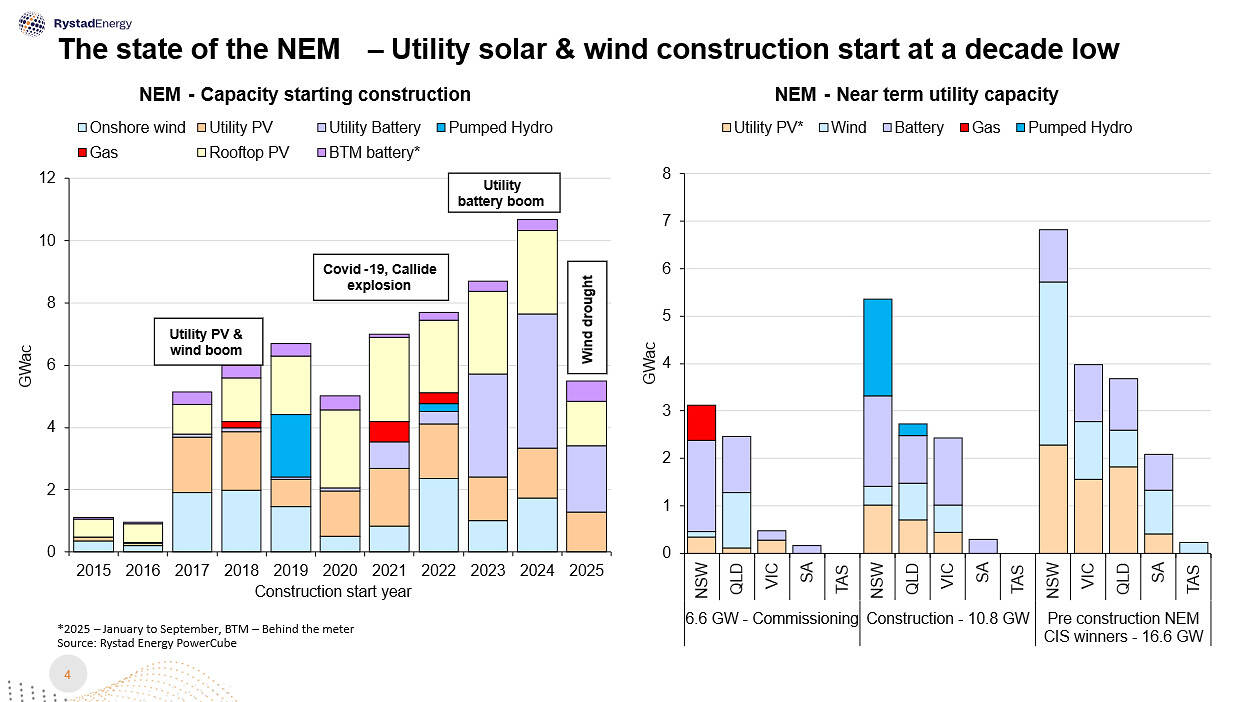
The NEM has experienced an unprecedented boom in both household and utility scale capacity starting construction since 2017. A whole host of factors have driven this, including (but not limited to), high wholesale prices in the energy market (as gas prices rose), high LGC prices (40-80 AUD/MWh for most of 2017-2024), declining capex for both solar and batteries and GW of Power Purchase Agreements being signed. The dynamics of the NEM are about to completely change, as ~8GW of utility batteries that are either commissioning (3.4 GW) or under construction (4.6 GW) set to be online in the next 12-18 months, mostly shifting energy from day to night. Once all this capacity is commissioned there will be ~29 GWh of utility batteries operational. Assuming they cycle 0.8 times / day that’s an additional 8.5 TWh/year additional demand, presumably mostly during the middle of the day. Significantly more than the 6.3 TWh of utility PV / Wind we’re currently curtailing each year. The household solar and battery dynamics are also changing rapidly as installations for rooftop PV have slowed in 2025, but household battery installations have skyrocketed thanks to the Cheaper Home Batteries program.
The three problems to solve
The way we think about the mix of any country is simply to look at the following three elements:
- Cheap bulk energy – What is/are the cheapest source(s) of energy to provide the bulk volumes of supply. This is region dependent, i.e. what renewables / fossil fuel resource is most abundant and what is technologically available / socially acceptable.
- Short duration dispatchable capacity (1-10 hours) – To be used for daily peaking or shifting of energy. These facilities have to be both flexible and dispatchable and are typically, gas, batteries or hydro.
- Long duration dispatchable capacity (10+hours) – Used to supply bulk volumes of energy during a longer unavailability of (1) – Cheap bulk Energy. This could be due to a drought (solar, wind hydro), unplanned outage of a coal or nuclear plant etc. This capacity is security of supply to back up the system.
The above categories are not mutually exclusive, for e.g. if a country has a very cheap source of domestic gas, a CCGT might provide the bulk energy and OCGT might provide the short / long duration firming. It is worth noting diversity of supply is also critical for security (what if the gas runs out). Its all region / system / technology availability & cost dependent….and costs change over short periods of time…quite a lot, so constant review is necessary.
Turning back to the NEM, here’s what the construction data presented earlier looks like if we classify the technology build into these three categories.
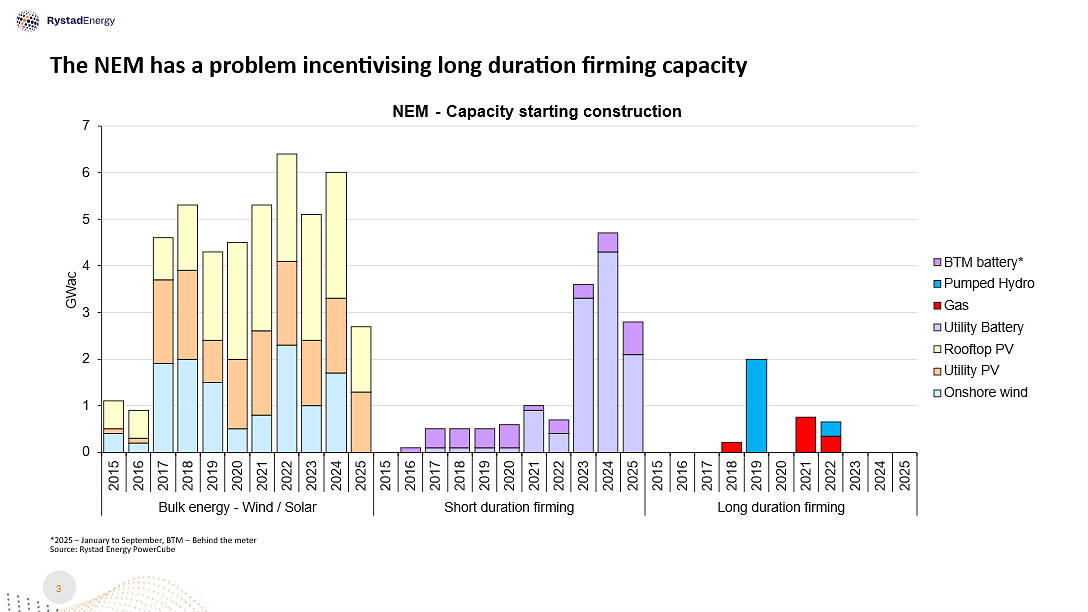
Of the three problems to solve, Australia is moving very fast on short duration firming, i.e. utility batteries, we’re currently the third largest market globally for utility batteries. Bulk energy I will touch on in the next section, but the obvious issue shown above is the NEM struggles to incentivize long duration dispatchable capacity in its current form (an article worthy of another article, by someone much smarter than i).
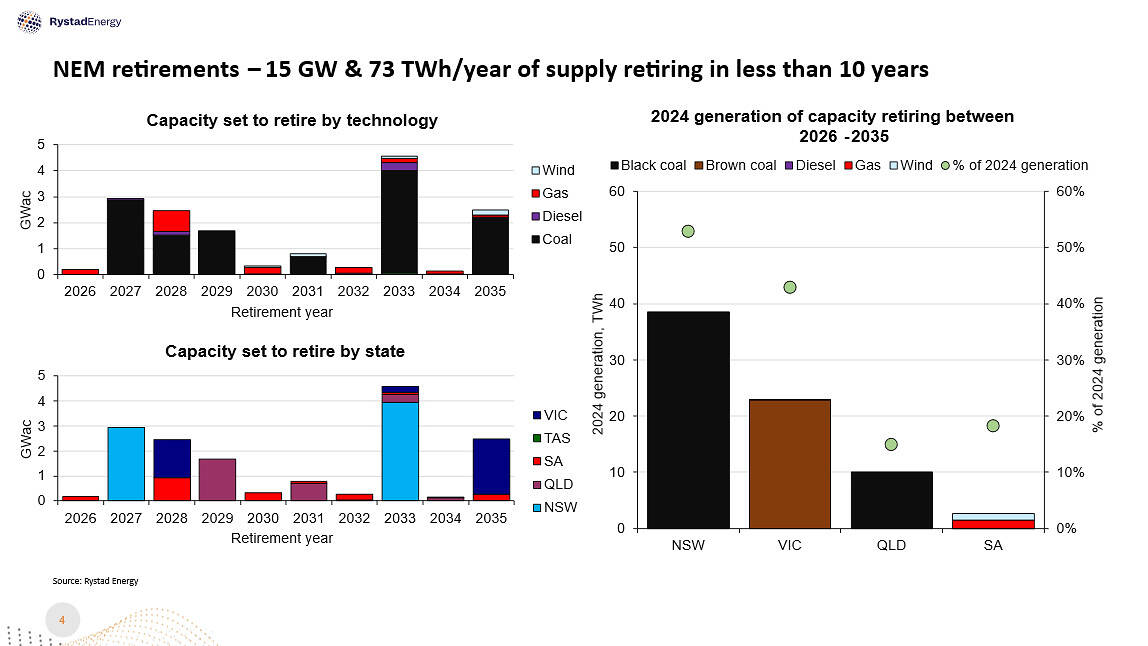
This becomes even more of an issue when we consider the retirement schedule ahead… 15 GW of long duration dispatchable capacity is about to exit the market. NSW is most exposed, the capacity retiring to 2033 (Eraring, Bayswater, vales Point) was over half the states generation in 2024.
So, what about bulk energy?
Australia has a target of 82% renewables by 2030, for which AEMO has stated “Renewable energy (1 – Bulk Energy) connected with transmission and distribution, firmed with storage (2 – Short duration dispatchable capacity) and backed up by gas-powered generation (3 – Long duration dispatchable capacity) is the lowest-cost way to supply electricity to homes and businesses.”
Clear enough! The obvious question is in what proportions to build the renewable energy? This is a moving target as costs and therefore the economics change so dramatically even within the two years between consecutive Integrated System Plans (ISP).
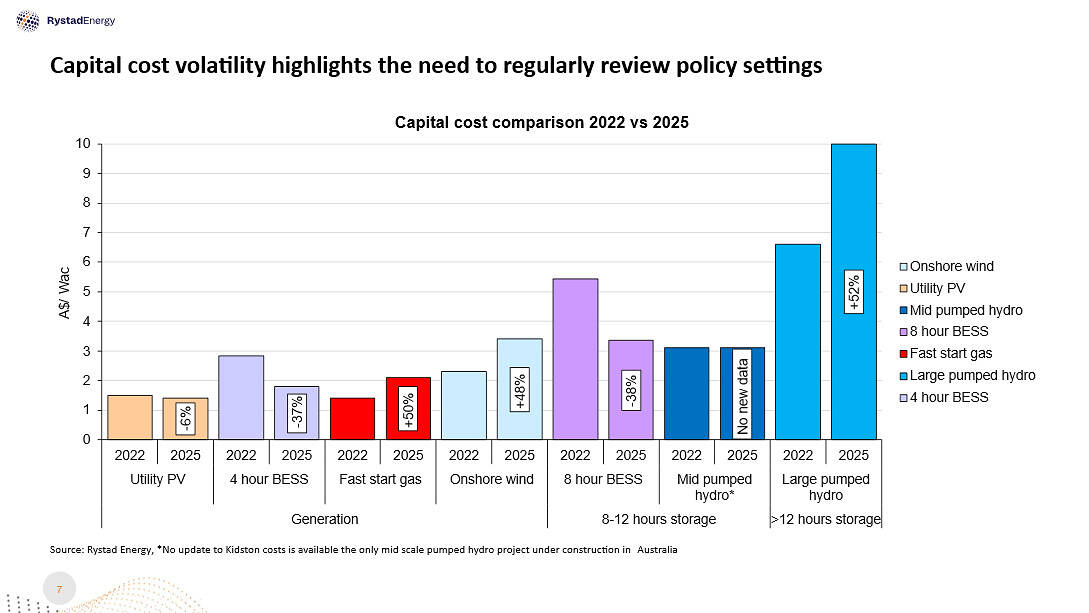
See below for a comparison of a CAPEX in A$/Wac for different technologies and how they’ve changed since 2022. Everything except solar and batteries has gone up at least 50%. To add further pain high voltage (500 kV) transmission costs have gone up significantly more than 50%.
Why does this matter?
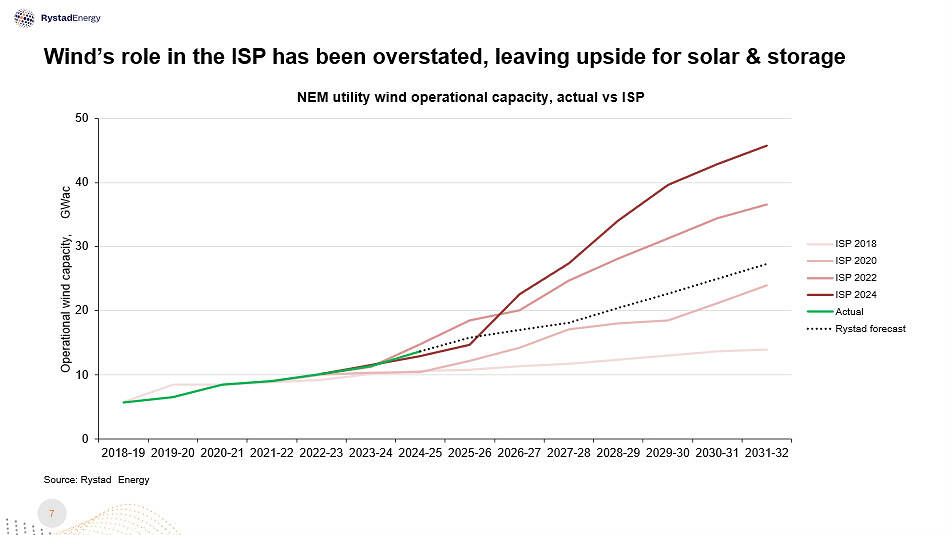
The most recent ISP (2024) highlights that the amount of operational wind capacity needs to be ~40 GW by 2030 up from the currently operational 14 GW and a further 1.7 GW in construction. Given it takes ~2-4 years to construct and commission a large wind farm in Australia most of the remaining capacity (40 – 14 – 1.7 = 24.3 GW) needs to start construction in the next 24 months to be operational by 2030. This equates to ~1 GW per month for the next 24 months, an unlikely outcome given that no new wind farms have started construction in 2025 for the NEM.
The Capacity Investment Scheme (CIS) hopes to help incentivise new generation to start construction, by providing floors for revenue. With ~20 GW of capacity awarded thus far, its not translating into projects moving to Financial close and starting construction. To date less than 3 GW of the 20 GW awarded has started construction, the majority of which are standalone utility batteries, which likely would have started construction anyway.
The key causes (in our opinion) for why a large proportion of the CIS capacity is unlikely to be operational by 2030 is because the project(s) have either bid too low (thus the banks won’t lend to them), the transmission is not yet available or the project has not been approved (the time taken to get through the approval process is worthy of another article).
So what does the NEM look like in 2030?
Putting this all together we (Rystad) foresee that Australia continues to transition to a wind & solar grid, but simply a slower pace than needed to meet the 82%. Our current view is the NEM reaches 60-65% by 2030 & 82% by 2037. The primary reason is simply the inability to start construction of 24GW of wind in 24 months. For historical context the NEM has only ever started construction of more than 2 GW of wind in a single year (0.17 GW/month) once (2022).
About our Guest Author
 |
David Dixon is a Senior Analyst in the renewables team at Rystad Energy. David’s area of focus is the utility-scale solar, wind and storage market in Australia. David has an undergraduate degree in Petroleum Engineering (University of Adelaide) and a Master’s of Photovoltaic Engineering (University of New South Wales).
You can find David on LinkedIn here. |
Be the first to comment on "24 GW in 24 months, a race against time for the NEM"