With respect to the ~17:00 period on Thursday 30th October 2025:
- we captured the moment soon after it happened, via ‘Frequency wobbles on Thursday afternoon 30th October 2025’.
- and have just posted ‘A second look at the frequency drop on Thursday evening 30th October 2025’
- and Michaela helpfully noted in her comment here that the low-point was 49.84Hz according to her measurements (so, if correct, just outside of the NOFB).
It was a simple step to continue some explorations here….
Trend of aggregate Dispatch Error by Fuel Type
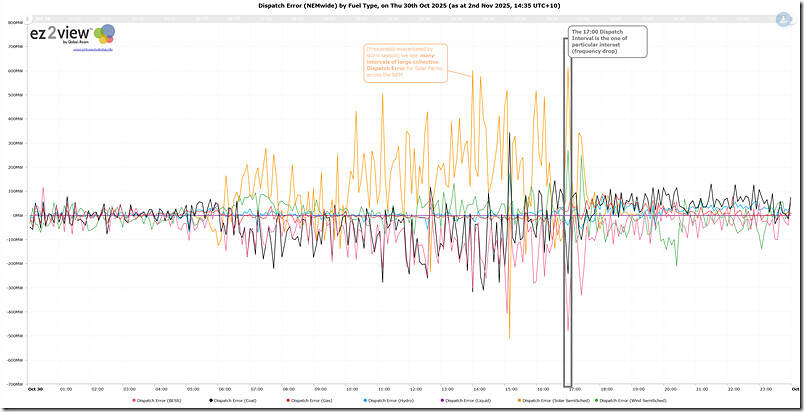
Using the same ‘Trends Engine’ query from ez2view that we recently deployed for the frequency disruptions on the following day, we’ve updated the query to produce the following trend of aggregate ‘Dispatch Error’ for each of the main fuel types across the NEM, on a NEM-wide basis:
From the chart, it’s pretty clear that:
1) There are many instances of large aggregate Dispatch Error for Solar Farms across the day:
(a) Which is not dissimilar to what we saw for the following day;
(b) Presumably with natural variability exacerbated by storm season … and feeding into both:
i. The underlying questions about ‘the forecastability of VRE’; along with
ii. Questions about the scalability and sustainability of Semi-Scheduled category.
2) As it happens, the 17:00 dispatch interval appears to be a confluence of several factors:
(a) Dragging the frequency down, we have a combination of:
i. A large collective under-performance across Solar Farms NEM-wide (Aggregate Dispatch Error = +613MW); compounded by
ii. A notable collective under-performance across Wind Farms NEM-wide (Aggregate Dispatch Error = +270MW).
iii. So, all-up, representing very large under-performance across Semi-Scheduled units of Aggregate Dispatch Error = +883MW.
(b) On the flip side, we see two large contributions trying to keep the frequency in control:
i. Largest was from BESS units NEM-wide (Aggregate Dispatch Error = =480MW);
ii. Assisted by Coal Units NEM-wide (Aggregate Dispatch Error = -242MW).
Dispatch Error (per unit) at 17:00 on Thu 30th Oct 2025
Focusing in just on the Semi-Scheduled units, but down at an individual unit level, we see the following distribution of Dispatch Error by unit….
Dispatch Error (Solar Farm units) at 17:00
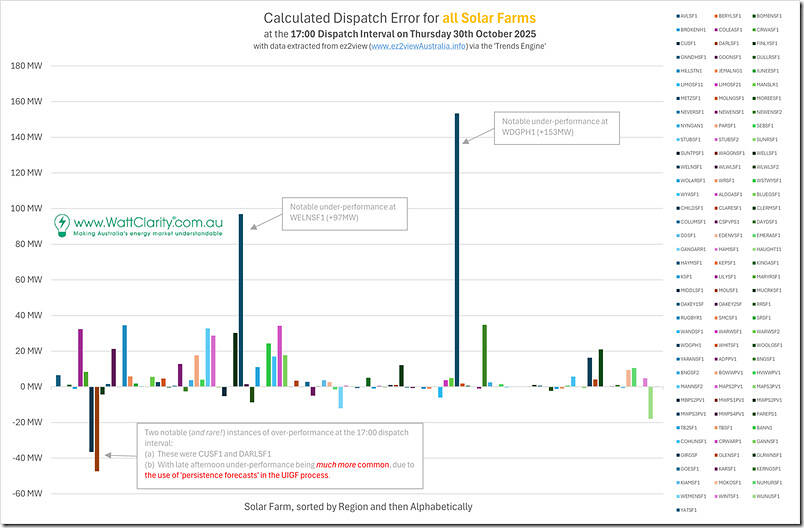
We’ll firstly look at the Semi-Scheduled Solar Farm units … of which we have 109 registered on this day (albeit that a couple were not even advanced to the point of having data on this day). Sorting firstly by region and then alphabetically, we see the following:
What jumps out to me in this chart is that:
1) There are many more DUIDs showing significant under-performance (positive Dispatch Error) than over-performance
… which (as explained on the image) is presumably because the UIGF processes used at each solar farm commonly use ‘persistence forecasts’ to determine what they might be able to produce in 5 minutes time.
2) Of these instances, there are many more showing large instances of under-performance (for instance, if we notionally say >20MW is large).
3) Add to this some particular dynamics at two solar farms (WELNSF1 and WDGPH1) that have exacerbated the result for aggregate Dispatch Error.
… I’ve not looked now (that’s not really the point of this article) but wonder if these would be storm related?
Dispatch Error (Wind Farm units) at 17:00
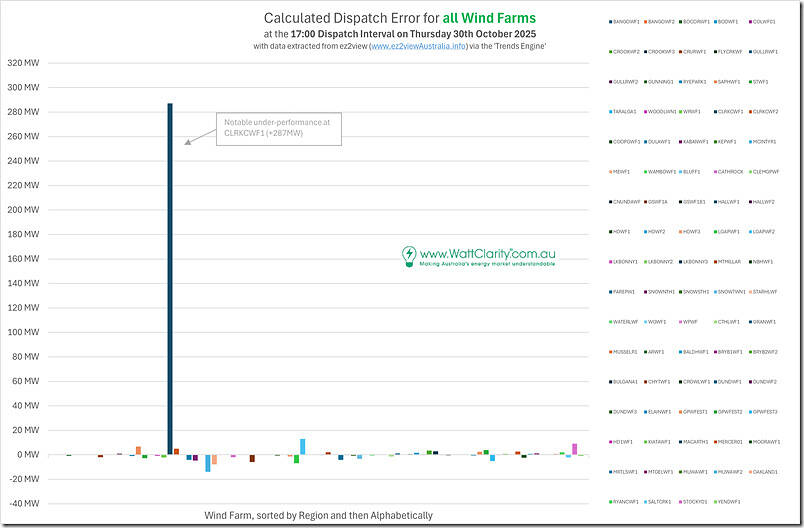
Taking a similar approach for all Semi-Scheduled Wind Farm units (84 of them) :
In this case we see that:
1) There was a very large under-performance at CLRKCWF1, with Dispatch Error = +287MW
2) But apart from this one:
(a) All deviations were under 20MW in size for this dispatch interval
(b) Furthermore, the separation was relatively even:
i. There were 31 DUIDs with some element of over-performance (largest being MCINTYR1 with Dispatch Error = –14MW)
ii. Compared to 28 DUIDs with some element of under-performance (next largest, after Clark Creek, being LGAPWF2 with Dispatch Error = +13MW)
So a quite different scenario compared to the fleet of Solar Farms.
What about those 3 x DUIDs with large Dispatch Error?
I thought it would be worth utilising the ‘Unit Dashboard’ widget in ez2view to take a look at specifics for each of the three units. In all three cases
- we’ve time-travelled back to 18:00 (i.e. an hour after the under-performances to allow a little ‘before and after’ view in the chart)
- but focused the table at 17:00.
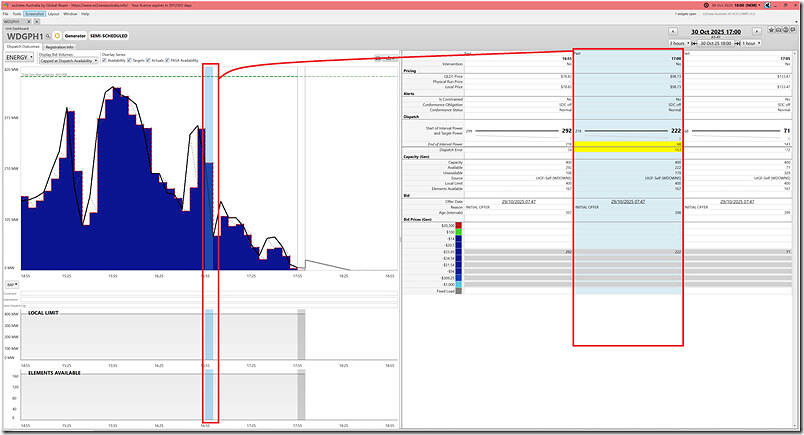
Solar Farm = WDGPH1 (Dispatch Error = +153 MW)
Let’s start with Western Downs solar farm, with the largest Dispatch Error of any Solar Farm:
In this case, we see the output bouncing during the 3 hour time-range, with the largest deviation at 17:00.
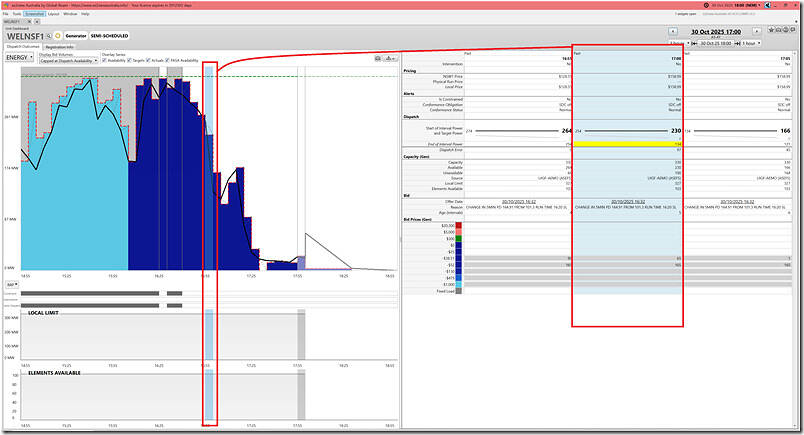
Solar Farm = WELNSF1 (Dispatch Error = +97 MW)
Next we’ll look at the Wellington North solar farm, with the second Dispatch Error of any Solar Farm:
In this case, we see the output bouncing during the 3 hour time-range (though not as much as for WDGPH1).
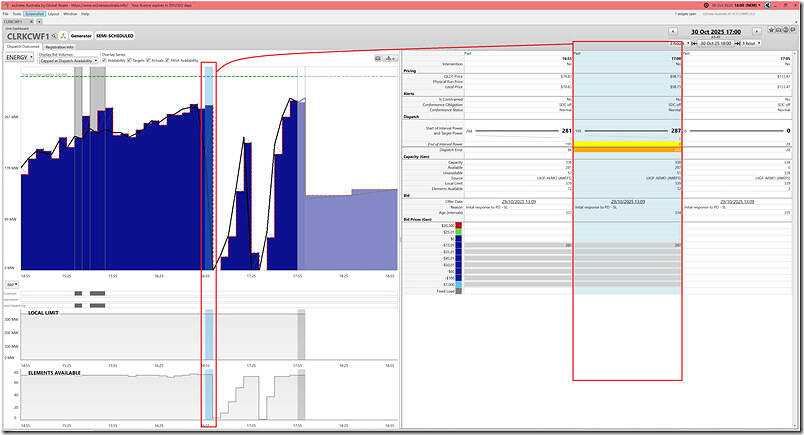
Wind Farm = CLRKCWF1 (Dispatch Error = +287 MW)
Let’s start with Clark Creek 1 Wind Farm, with the largest Dispatch Error of any Semi-Scheduled unit:
In this case, we see some pretty large gyrations in output, beginning at the 16:55 dispatch interval and iterating over the next hour … including with the ELAV (Elements Available) the unit.
I’ve not had time to look further in order to understand … was this something commissioning related, or due to something else (the bidding does not seem to provide clues, on quick scan)?
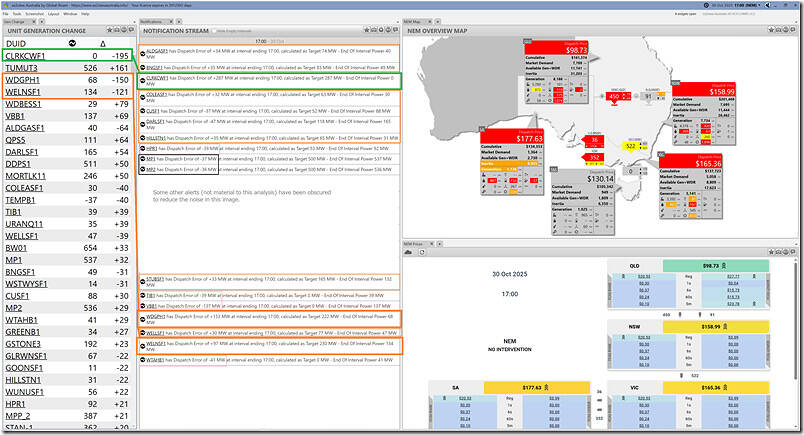
Summarising the 17:00 dispatch interval
Finally, to wrap this article, I’ve composed a window with four widgets in ez2view and time-travelled to the 17:00 dispatch interval (NEM time) on Thursday 30th October 2025:
… and that’s where we’ll leave this article for today.


Interesting. Thanks. Isn’t about time we stopped approving large solar farms unless they have at least 30min battery backup to hold up output until scheduled generation can ramp up?