
Editor’s Note: This article is adapted from the transcript of a presentation given by Matt at the Battery Asset Management Summit in Sydney on August 26th, 2025.
This article addresses two questions relevant to NEM market participants:
- How has the NEM’s fleet of Battery Energy Storage Systems (BESS) traded and operated on recent peak days?
- What capabilities belong in a trader’s toolkit to navigate those days effectively?
Fluence’s Mosaic bidding system is used by market participants to define and execute trading strategies at over 20 grid-scale BESS, so my team is closely involved in supporting participants with the day-to-day trading and operations of a substantial proportion of the NEM BESS fleet. In this article, I will share insights and lessons learned from several recent peak days, gleaned from public operational data.
I’ll explore how the BESS fleet has diverse objectives and operations, how BESS are trading using a combination of algorithmic bidding tools + human direction, and how benchmarking or quantifying a BESS’ trading performance can be more complex than it first appears.
A deep dive on three key days in June
I’ll use three key days from 2025 – June 12th, June 18th, and June 26th to illustrate narratives about the NEM’s BESS fleet, how BESS are trading, and the role BESS are playing in the wholesale market. The chronology is important, because we’ll see how lessons learned are quickly picked up and applied, for better or for worse.
The following chart shows total daily wholesale revenues for the aggregate BESS fleet to set some context for the relative magnitude of each of these three days.
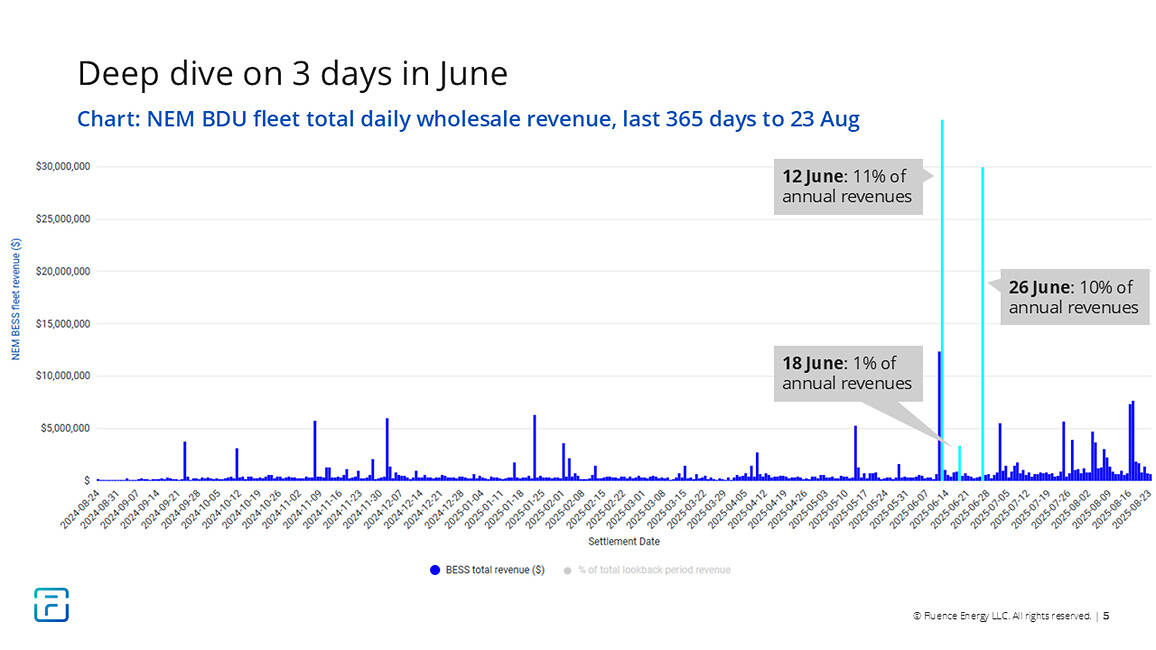
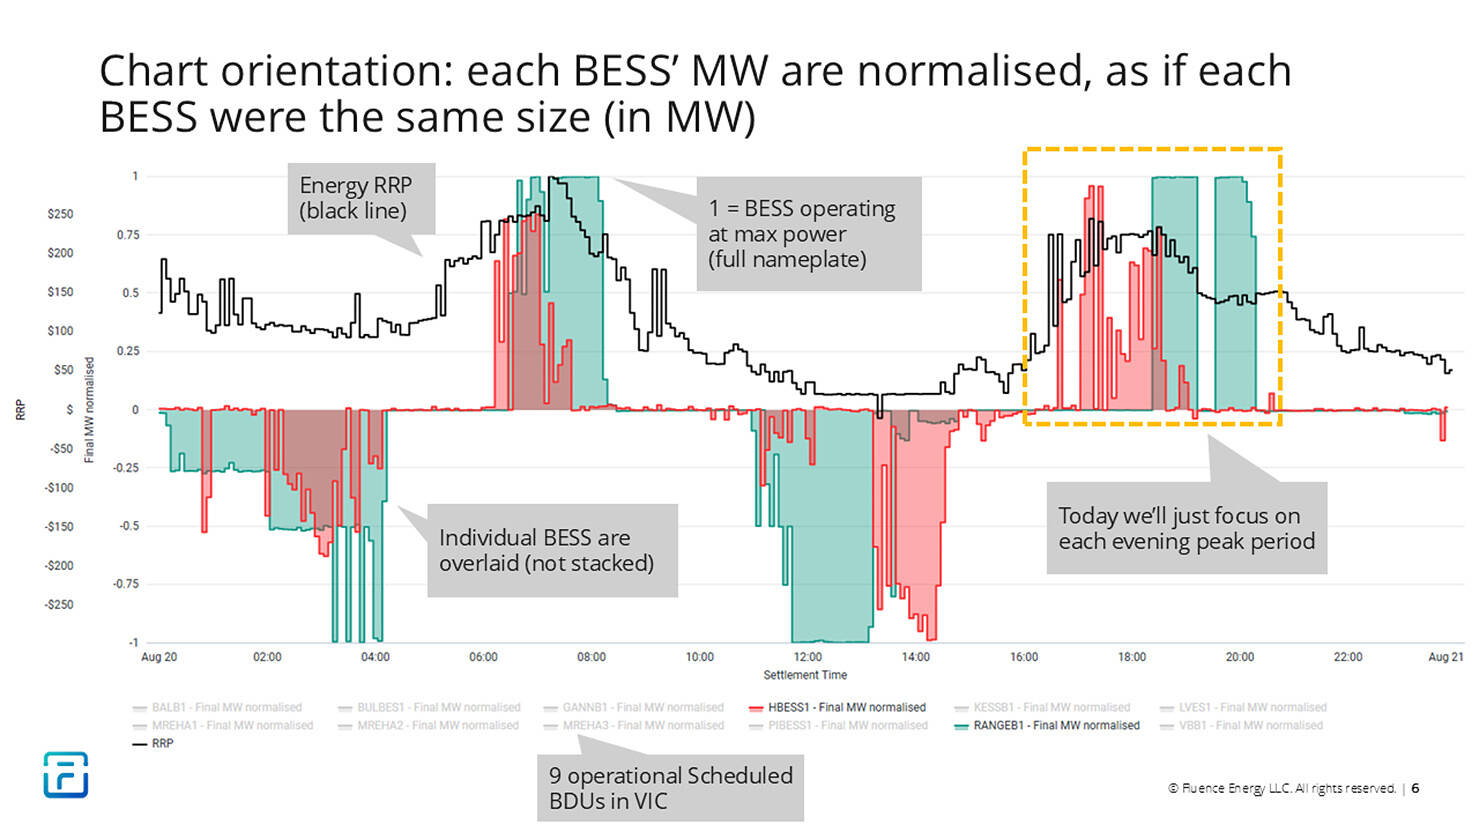
The analysis leverages a somewhat unique style of chart to explain what happened on each day. The chart seeks to broadly visually identify how well each BESS allocated its available power (in MW) into the highest prices of the day, by using two left-hand axes. The visual below (showing an example from a “normal” price day) explains how to read each chart.
Each chart will focus on the Victorian BESS fleet, but the observations are broadly applicable to the fleet NEM-wide. The analysis considers only on the fleet of “Bi-Directional Units (BDUs), which (at current) means standalone BESS > 5 MW.
Day #1: June 12th (the big picture)
Editor’s Note: There’s a collation of articles here pertaining to Thursday 12th June 2025 that some readers might appreciate, for some more context.
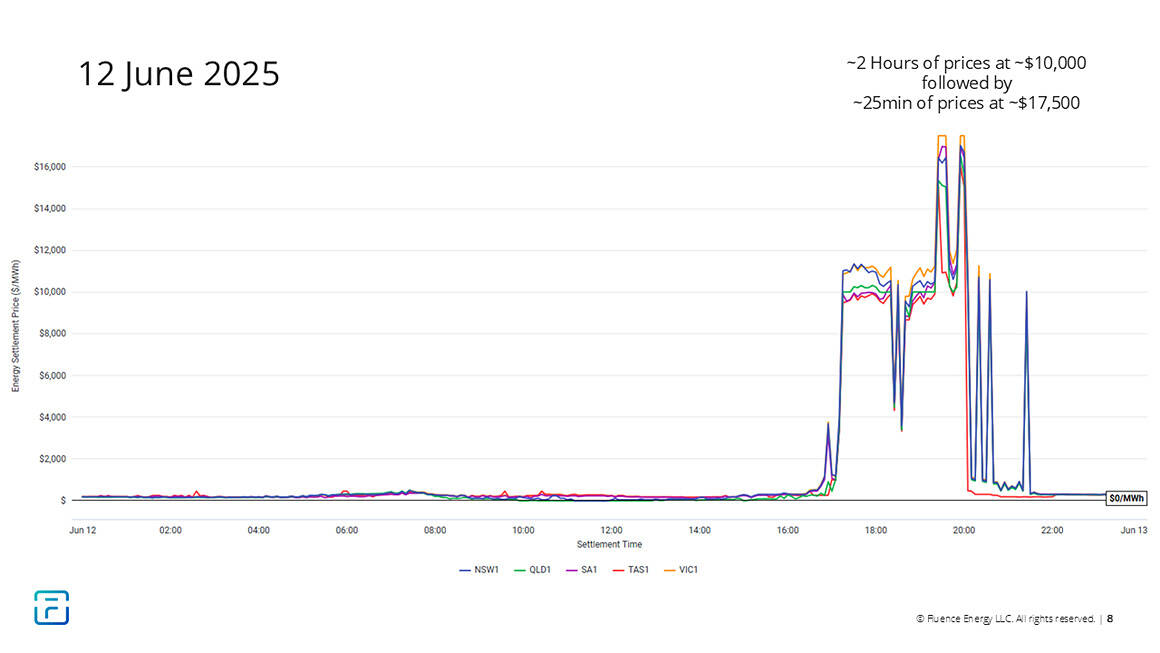
The chart below shows the final settlement price outcomes in each region. Prices were generally of the same magnitude in all regions. $17,500/MWh was the Market Price Cap, at the time.
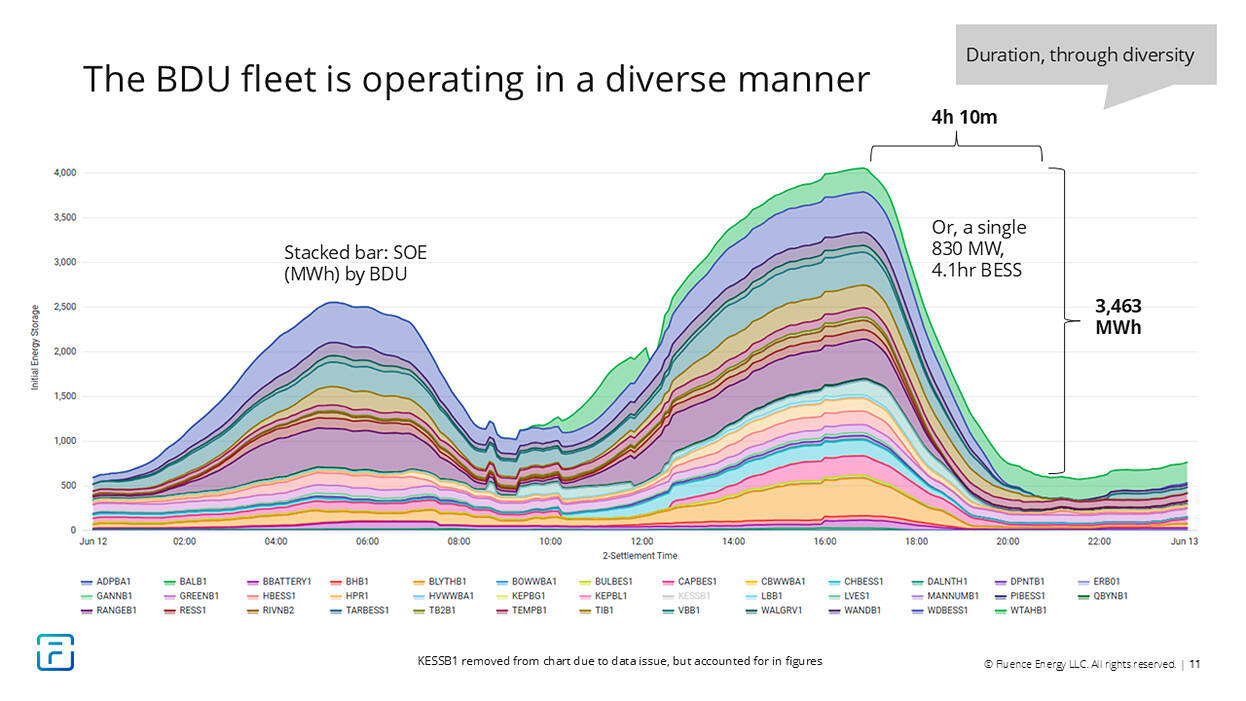
The next chart shows a stacked area chart of how every BESS managed its state of energy (in MWh) on June 12th. There are 38 BESS on this chart, almost all of them 1-2 hours in nameplate duration.
But in the aggregate, the BESS fleet chose to operate in a manner that saw battery capacity delivered over a 4-hour period. In aggregate, the fleet behaved more like a single 830 MW, 4hr BESS.
It’s clear from the data that the individual BESS are not just all trying to do the same thing at the same time. There is a diversity of strategies, positions, and risk management tolerances evident across the fleet. I call this effect ‘duration through diversity’, which I submit is a good thing for both the market and the power system.
In pursuing individual strategies and objectives, a bunch of “short” duration batteries provide a system-facing capacity that is much longer, in aggregate.
The details surrounding June 12th
Next, let’s dig into how individual BESS in Victoria traded on June 12th.
Hindsight is 20/20 and it’s easy to be a ‘Monday morning quarterback’, so observations must be made thoughtfully, acknowledging that a market participant’s strategy, objectives, or risk management preferences are not fully discernible from the public data, and with recognition that real-time trading decisions are made with limited information. This analysis does not single any BESS out, or to seek to quantify any BESS’ performance.
The chart below shows three Victorian BESS overlaid on each other, selected at random. In general, each BESS discharged at full nameplate capacity into the $10k prices on offer, and didn’t capture any of the $17.5k intervals.
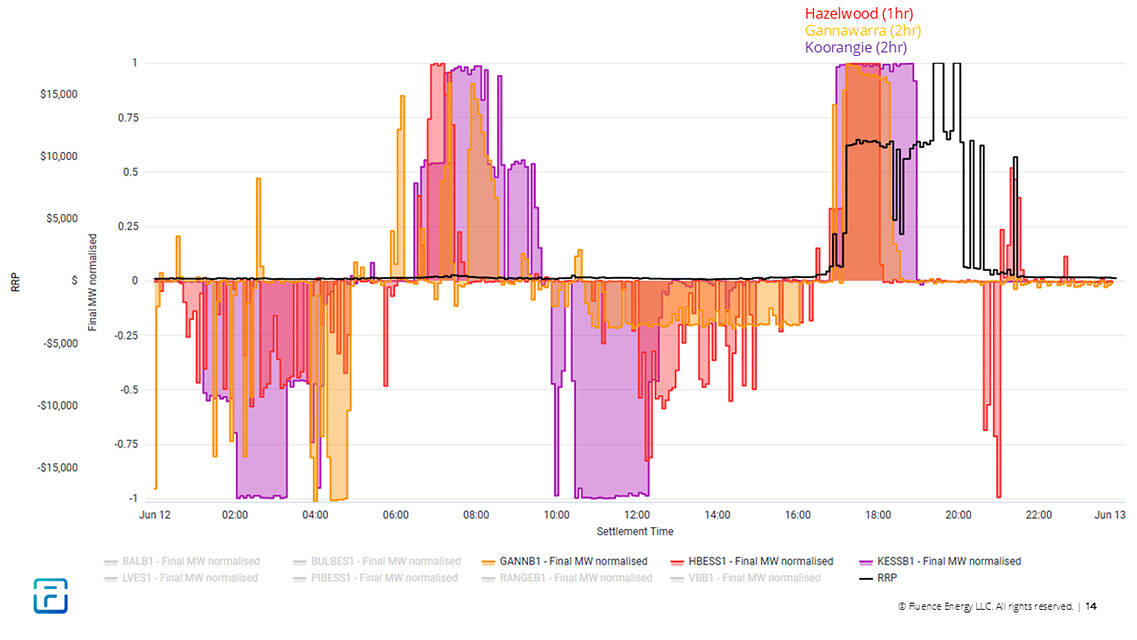
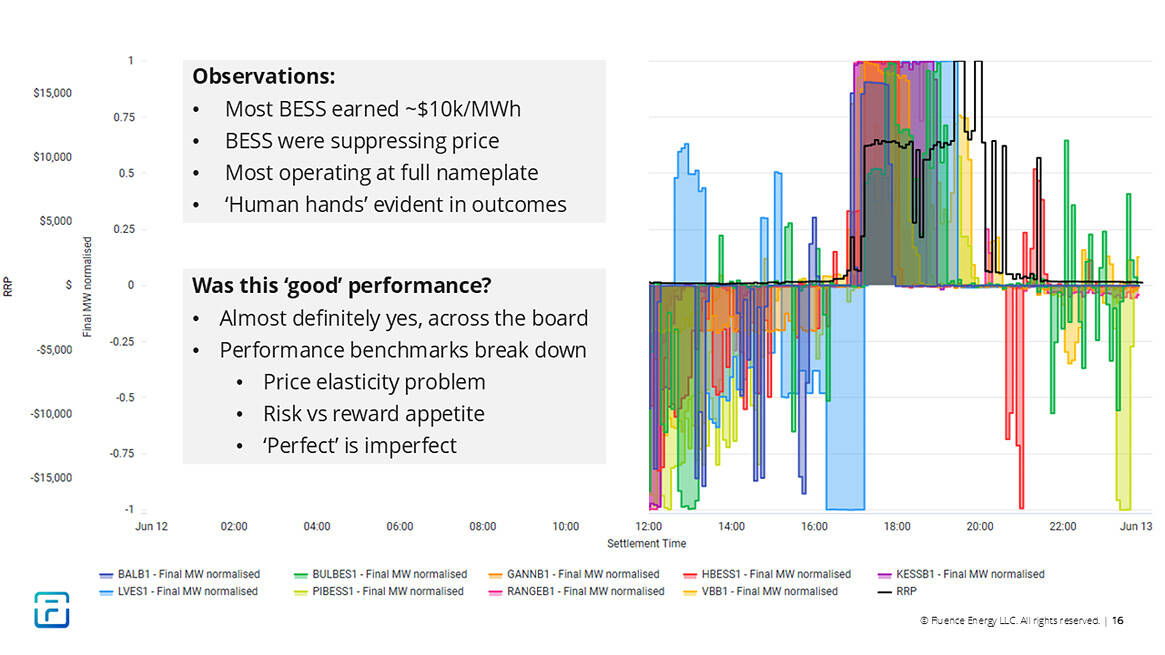
The next chart adds the remaining Victorian BESS (there are nine in total). This makes the chart somewhat messy and obscures individual outcomes, but there are some clear aggregate observations detailed below.
The key observations from June 12th are:
- Most BESS earned $10k and none particularly captured the $17k intervals: Only a couple BESS caught a piece of the $17k intervals, and only fleetingly and at low output. There are two reasons for this:
- The first is price elasticity. If you had put one or two more BESS into those $17k prices, the prices wouldn’t have eventuated at all. The BESS fleet was suppressing the price over the early part of the peak. The price only hit $17k when the BESS fleet ran out of energy, and higher priced (mostly gas) units were the last units standing.
- The second is that sitting out two hours of $10k prices, on the hunch that your BESS will have the opportunity to earn $17k later, would be an incredibly risky trading strategy. A trader would need serious convictions to make a call like that. The trader would have to be willing to face their boss in the morning and explain why they sat out an opportunity to earn (for example) a million dollars but instead earned virtually nothing because they thought they might have been able to earn $1.5 million dollars.
- Most BESS chose to operate a full power capacity: When prices started hitting 4-digits, most BESS ramped to their maximum power (MW) and generally remained there until they ran out of energy (MWh).
- Human hands are evident in the outcomes: On June 12th some BESS exhibited atypically reduced number of rebids, and some were bidding within price ranges that suggested their traders were tightly controlling the price ranges where their bidding systems were placing volumes.
At Fluence, we have some customers who are happy to let the algorithms drive on key days, and some who would rather layer on constraints and overrides to more explicitly specify their on-the-day risk-reward appetites. Our market participant customers have diverse risk/reward preferences, and some have quite specific policies and tolerances they need to meet.
The price forecasting and optimisation algorithms generally perform very well on peak days, but they can’t read a trader’s mind or know what they’re feeling. It’s hard for algorithms to know a trader’s willingness to incur opportunity costs, or their willingness to be wrong.
We’ve tried to build our bidding system to allow traders to specify those risk preferences, using anything from a soft constraint, like collaring the price bands used or setting min/max SOE targets, to hard overrides like specifying a manual bid. We built our bidding system to empower traders to trade in accordance with their own preferences, and a layer of services to support them with doing that.
Was this a good trading “performance” from the BESS fleet?
Almost definitely yes. June 12th is a day where if you tried to measure trading performance or possible revenue capture with a ‘percent of perfect (PoP)’ metric, the metric will tell you that these BESS had a terrible day, with most returning PoP performance < 50%. In reality, if you asked these traders if they are happy with their BESS’ outcomes, most would respond with a resounding ‘yes’.
A ‘perfect’ revenue capture counterfactual breaks down on a day like this, for the same reasons mentioned above: due to price elasticity effects, each BESS could not actually have earned $17k, and because holding out for $17k is an incredibly risky trading strategy.
Any analysis that suggests that BESS X could have made more money if it had just done Y instead of Z may be overly simplistic and may mischaracterise the BESS’ performance. A market participant needs to judge its own performance against its own risk management preferences, and for most BESS in Victoria, June 12th was a good day.
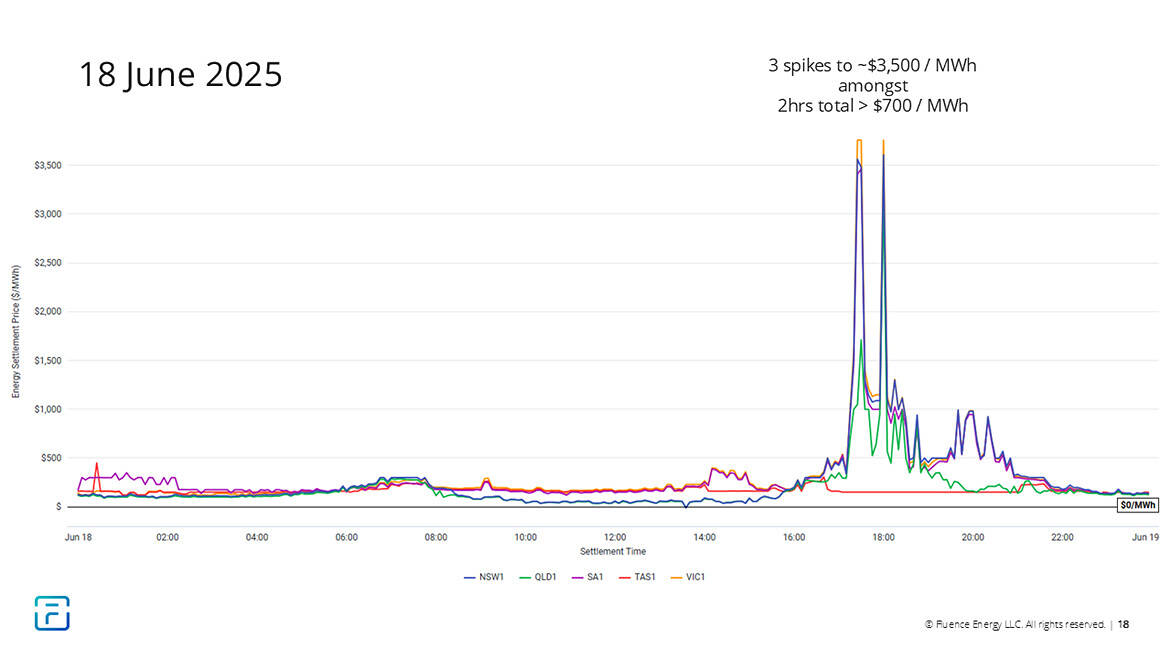
Day #2: June 18th (6 days later)
Editor’s Note: There’s a collation of articles here pertaining to Wednesday 18th June 2025 that some readers might appreciate, for some more context.
The chart below shows how prices turned out. Like June 12th, most of the NEM generally moved as one (except for the Tasmania region), but overall, prices were significantly lower than on June 12th.
Here are four of the Victorian BESS overlaid on each other, again selected at random. Most of the BESS largely sat out the highest prices of the day, around 18:00 (assessed with the benefit of hindsight).
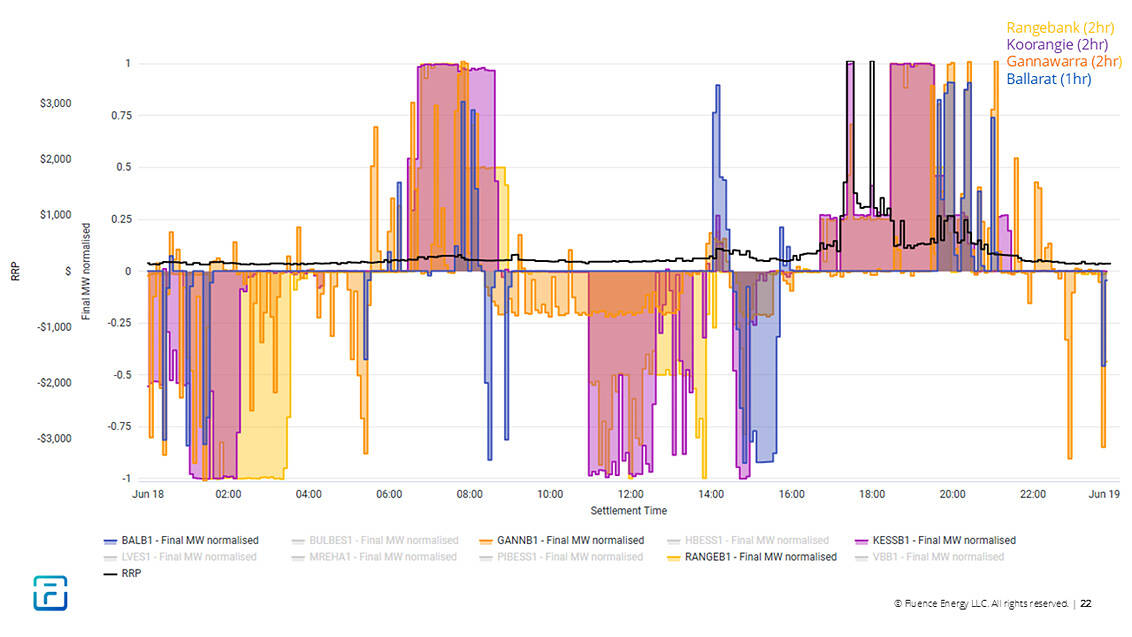
The next chart overlays all nine Victorian BESS.
The key observations from June 18th are:
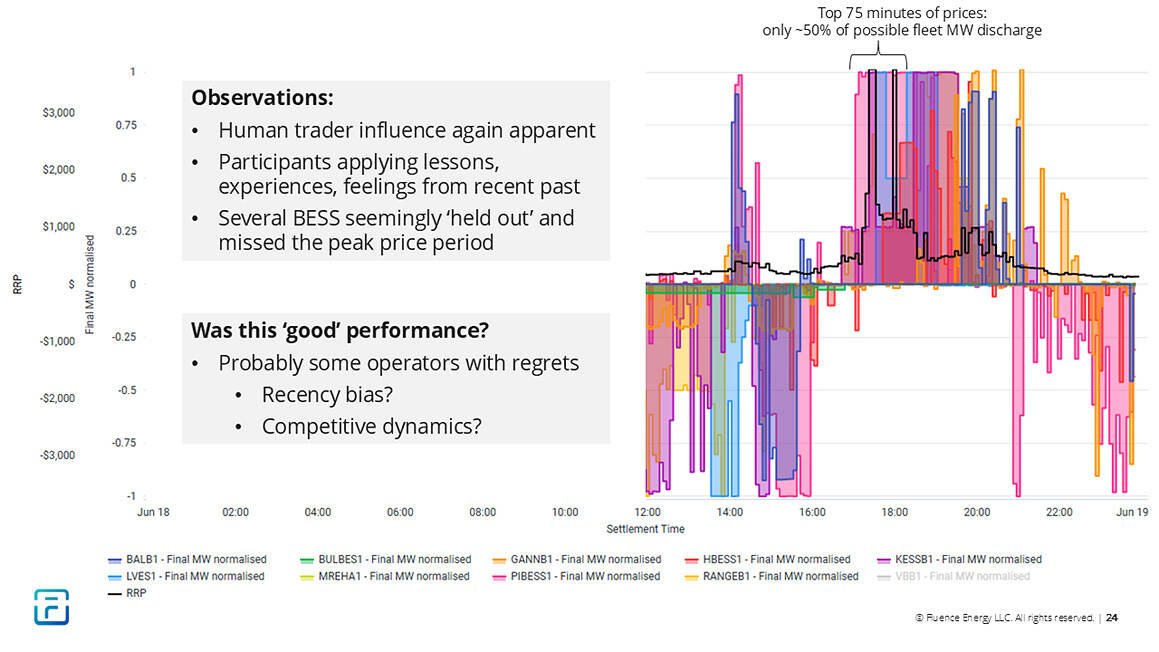
- The influence of human traders was (again) apparent. Based on rebid counts and bid price ranges, many traders were clearly providing extra guidance to their bidding systems.
- Several BESS seemingly ‘held out’ and missed the peak prices of the day. Looking back on the top contiguous 75 minutes of prices, the Victorian BESS fleet only put about 50% of its available energy into that period.
- BESS Traders were seemingly applying lessons, experiences, and feelings from the recent past. In contrast to June 12th, on June 18th many BESS held back and operated below their nameplate capacity during the initial 4-digits prices in the early part of the evening peak, perhaps hedging their bets and hoping for higher prices later. It is possible that June 12th was still fresh of mind for some traders and influenced their decision-making and their risk appetites. If that were the case, some traders would probably look back on this day and consider that they applied a rational risk appetite, but that their strategy simply didn’t pay off.
Was this a good trading “performance” from the BESS fleet?
Probably less so than June 12th (noting that revenues overall were still relatively high, with June 18th the 17th highest revenue day in the past year, in aggregate). There are probably some traders with regrets who, with the benefit of hindsight, wish they had expressed their risk appetite differently and priced more capacity into the early part of the peak. That said, the price elasticity effects and competitive dynamics are complex, and it is difficult to confidently say what could have happened if even a few BESS had made different decisions.
Day #3: June 26th (8 days later)
Editor’s Note: There’s a collation of articles here pertaining to Thursday 26th June 2025 that some readers might appreciate, for some more context.
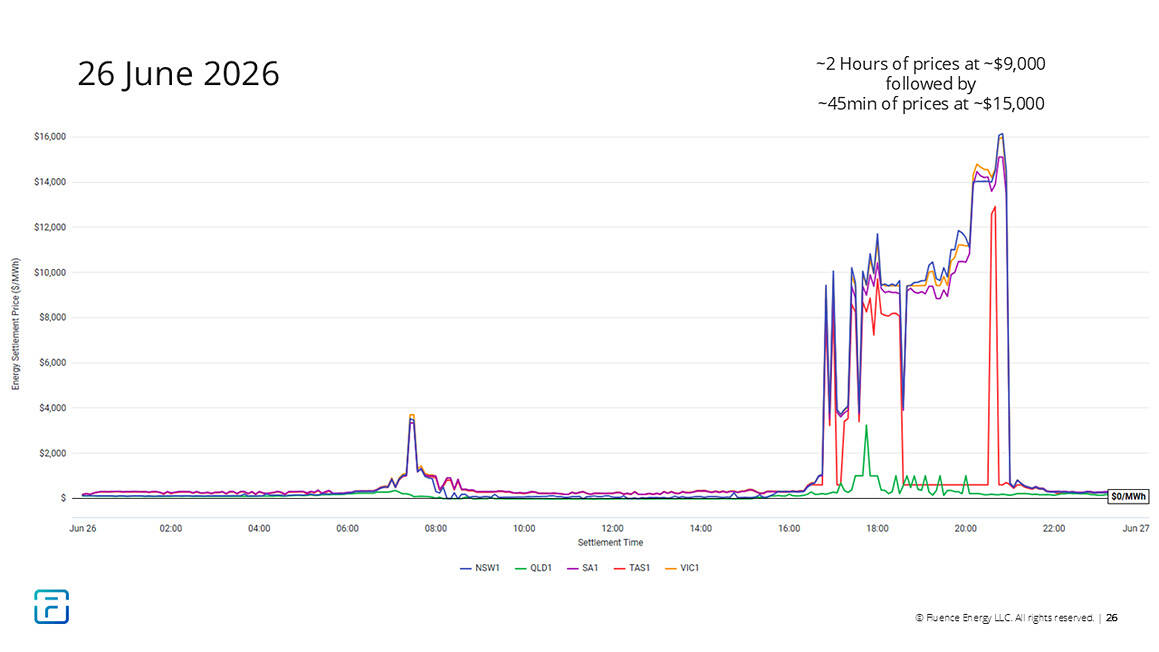
Prices on June 26th turned out similarly to June 12th. All NEM regions besides Queensland saw significant five-digit prices.
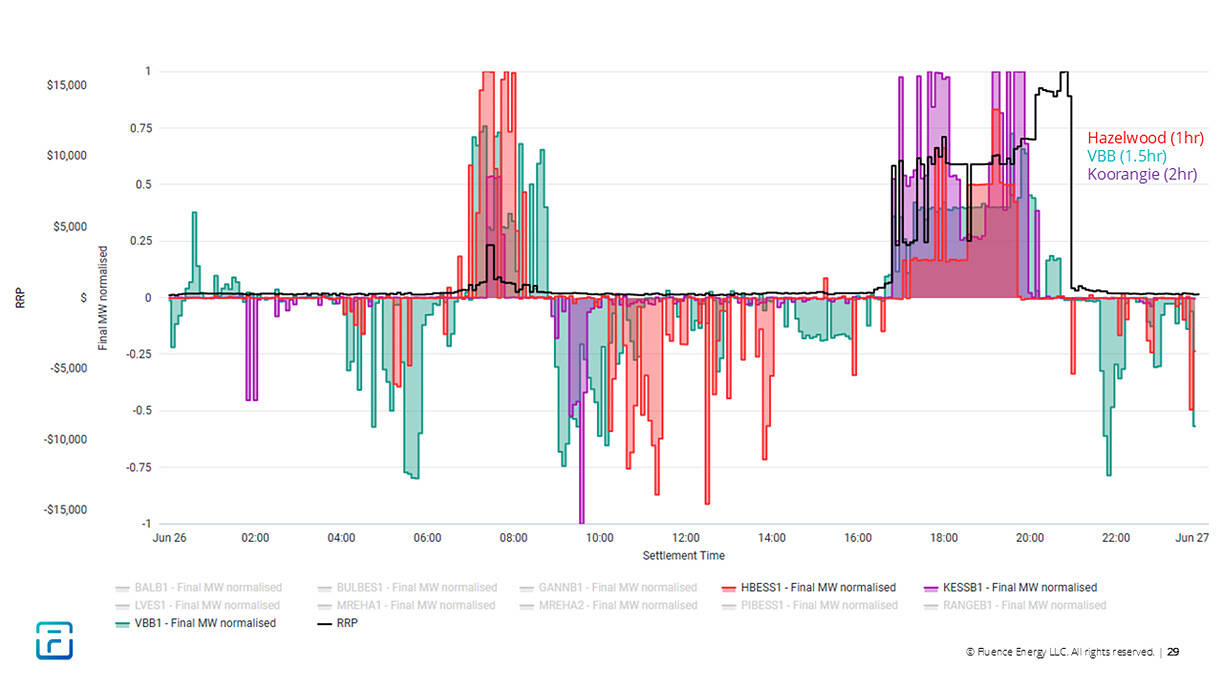
The next chart shows three individual BESS overlaid, again selected randomly. The operating profiles are significantly different to June 12th. I will explore why below.
The next chart adds all nine Victorian BESS into the overlay.
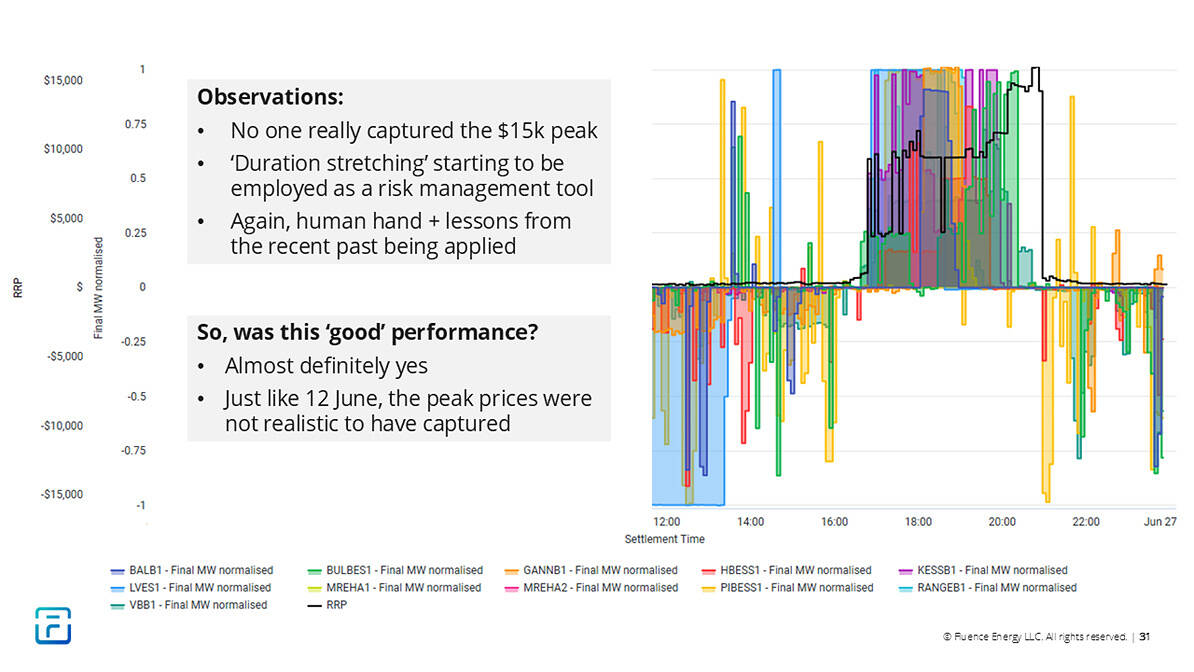
The key observations from June 26th are:
- No BESS particularly captured the $15k prices. This is due to the same effects we observed on June 26th, where the BESS fleet was helping to suppress the price, and the price only rose once the BESS fleet ran out of stored energy, and more expensively bid units were dispatched as the last units standing.
- ‘Duration stretching’ is starting to be employed as a risk management tool. In contrast to June 12th, where most BESS discharged at their full nameplate capacities until they ran out of energy, on June 26th, many BESS traders hedged their operations, ‘stretching’ their energy (MWh) over a wider timeframe by dispatching a lower capacity (MW). This risk management strategy gives a BESS a better chance of covering price spikes, with a trade-off of a lower dispatched volume. This strategy may or may not ultimately pay off.
- Again, the human hand of traders is evident in outcomes, with lessons from the recent past seemingly being applied. Similar to June 12th and June 18th, many BESS were evidently being traded with the guiding hand of a human trader, using a combination of human input and algorithmic execution. In addition, many traders seemingly applied a risk/reward lens that favoured the ‘bird in hand’ of $9k, over the risker possibility of $15k later. It is possible that some traders applied this lens with the recent lessons of June 18th (where some BESS seemingly held out too long) fresh in mind.
Was this a good trading “performance” from the BESS fleet?
Almost definitely yes. Just like on June 12th, the peak prices could not have realistically been captured due to the price elasticity problem, and in any case, would have required a large appetite for risk. On a simple ‘percentage of perfect’ metric, most Victorian BESS would score poorly, but most market participants would be satisfied with their trading performance and revenues on this day.
Overall takeaways from the three peak days in June
- Lots of individual short-duration BESS pursuing their own objectives has a diverse, long-duration aggregate effect on the market and on the power system.
- Market participants have varying risk appetites and risk/reward tolerances. The observations from June show that it is not the case that the BESS fleet trade the same way or operate at the same times, even when executing their strategies using bidding systems from a common supplier.
- Behind every algorithmic bidding system is an attentive spot trading team, guiding the BESS’ bidding system, applying a view on risk vs reward, and adapting strategies over time.
- ‘Duration stretching’ is an emerging risk management technique being employed by many BESS on peak days.
- Performance benchmarking and ‘percent of perfect’ metrics can be imperfect on big days, and may not be reliable or useful, without consideration of the objectives of the trading strategy on the day.
What capabilities belong in a trader’s toolkit to navigate these types of peak days effectively?
Reflecting on the lessons my team has learned from the past > 6 years helping market participants bid into the NEM, together with the specific observations from key days on June 2025, what tools and organisational capabilities does a market participant need to be a savvy BESS trader?
- Good price forecasting: You need reliable, probabilistic price forecasting to help you assess the day ahead and whether you’re comfortable letting your algorithmic bidding system execute your default strategy, or you want to give the bidding system some additional guidance.
- Good decision-making processes: It’s not all about technology. In addition to a good price forecast and a good optimisation engine, you also need good people, good processes, and good preparation. It’s important that you’ve got defined trading protocols prepared in advance so your team knows who is empowered to make what kind of decisions on the day.
You don’t want to be figuring out what you’re going to do in the heat of the moment. My team at Fluence has been through this process with several of our market participant customers, helping them define and implement their trading protocols.
- A flexible bidding system that allows trader input and overrides: Your bidding system can’t be a black box or an autopilot; you need to be able to jump in and guide the bidding strategy in accordance with your preferences. Every trader is going to have a different comfort level with algorithmic automation vs human control, and we’ve worked hard with our customers over several years to give them the tools they need to do this effectively.
- A well-resourced analytics capability: It is not enough to have only a capable bidding system and a capable human trader on the real-time desk, you also need resourcing to review outcomes and glean lessons learned after the fact. It can require significant time investment to review outcomes and run counterfactuals – a lot can happen in a day with 288 trading intervals. Additionally, the analysts and engineers who built and manage your bidding system need to be an integrated part of your trading operations so they can hear feedback from the traders, help traders feel comfortable with the bidding system’s mechanics, and improve the bidding system over time.
Your bidding system won’t just automatically surface the insights you need to improve your trading performance. Gleaning and applying lessons learned takes time and commitment and experienced people. At Fluence, we’ve structured our team to provide these types of support services to our market participant customers, to help our customers achieve their trading objectives, and maximise their risk-adjusted revenue returns.
About our Guest Author
 |
Matt Grover is the Director of Energy Markets at Fluence. Matt’s team works to develop and deliver Fluence’s algorithmic optimisation & bidding software tools, which are used by a significant portion of the NEM’s grid scale BESS and renewable generation fleet. Matt has more than a decade of experience in NEM market operations, across both the supply and demand sides of the market.
You can find Matt on LinkedIn here. |
Very interesting. The casino that is NEM. Know when to hold them, know when to fold them, know when to run!
I wonder if there is a way of calculating how efficient the fleet was at capturing the high prices with the benefit of hindsight? Then you could track this statistic over time to see if there is a trend.