On 1st April 2025 we wrote ‘What’s the problem(s) with dispatch targets arriving ~20 seconds into the Dispatch Interval?’ and, within that article, flagged that we’d come along later and post an article to highlight that there are several different ramp trajectories that are material to dispatch in the NEM.
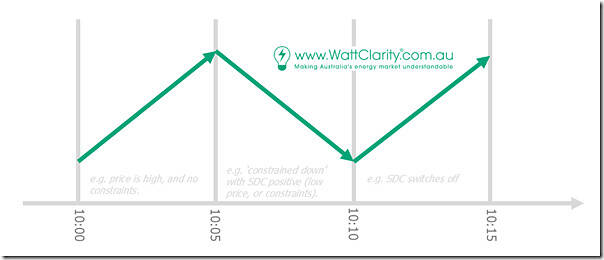
To illustrate this, pictorially, please see below a rough sketch of three sequential dispatch intervals showing ramp trajectory for a fictitious Semi-Scheduled unit:
In each of these three dispatch intervals:
1) For the 10:05 dispatch interval shown (remembering that the NEM uses an ‘interval-ending’ naming convention):
(a) Let’s say that there is no Semi-Dispatch Cap flag in this dispatch interval …
(b) This will mean that that the unit is free to follow the wind or solar energy resource in terms of its actual trajectory;
(c) though it’s important to understand the unit will still be given a Target … just that it will be at its Forecast Availability* (i.e. UIGF).
i. which, even though it will not be used to assess Conformance, will still be relevant to other measures…
ii. such as the apportionment of Regulation FCAS costs; and
iii. broader system wide measures like Aggregate Raw Off-Target.
* a useful point to remind readers of how Linton previously explained ‘What inputs and processes determine a semi-scheduled unit’s availability’.
(d) In this case, we see the unit ramping up (e.g. as the wind resource ramps up).
2) In contrast, for the 10:10 dispatch interval:
(a) Let’s assume that the Semi-Dispatch Cap flag is triggered:
i. Which might be because of transmission transmission congestion; or
ii. It might be because the spot price has dropped below their bid price (i.e. economic curtailment).
… does not matter which, for the point of this exercise.
(b) In this case, the unit is ‘constrained down’ to a lower level
(c) And, following the clarification in the AER Rule Change in 2021, means that:
i. The Semi-Scheduled unit must not exceed the Target;
ii. And must also not be underneath the Target except by the amount that the Wind or Solar Resource has dropped.
3) Stepping into the 10:15 dispatch interval:
(a) Let’s assume that the Semi-Dispatch Cap flag is lifted;
(b) Which frees the Wind or Solar unit to follow its energy resource higher.
Note that this type of scenario is also quite possible to unfold for a Scheduled unit (albeit the specifics might be different in each case), so readers should not take read into this example that the ramp profiles only apply to Semi-Scheduled units!
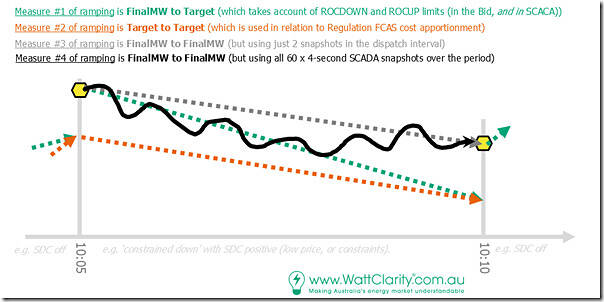
Now let’s focus in specifically on the 10:10 dispatch interval, in which the Semi-Dispatch Cap flag is triggered, and the unit is being ‘constrained down’:
In this case, we’ve highlighted four different ramp profiles (in different colours) to help readers appreciate the complexities within the dispatch interval:
Ramp Profile #1 is shown as being ‘FinalMW to Target’
(a) Which is assessed by NEMDE in determining the Target;
(b) And takes account of implicit constraints, such as the unit ramp rates
…. which might come from the bid, or from SCADA.
Ramp Profile #2 is shown as being ‘Target to Target’
(a) Which is used in the apportionment of Regulation FCAS costs;
(b) Which is particularly topical at this point, given there’s only ~9 weeks to go before the method changes:
i. From the flawed ‘Causer Pays’ method;
ii. To ‘Frequency Performance Payments’ (though readers should remember that FPP is about more than just Regulation FCAS costs.
(c) In the hypothetical example above, we’ve seen that the unit (in the prior dispatch interval, ending 10:05):
i. achieved a FinalMW substantially above its Target
ii. meaning that the starting point for Ramp Profile #1 and Ramp Profile #2 are very different
iii. which have flow-on implications in various ways (that are not discussed in this article).
Ramp Profile #3 is shown:
(a) as being closest to ‘actual’ ramp profile possible using just 5-minute cadence data,
(b) being linear interpolation from ‘FinalMW to FinalMW’
(c) In the hypothetical example above we see that:
i. the unit’s dispatch system does not obey the Target from the AEMO (which can happen for a variety of reasons);
ii. as a result of which the Conformance Status would be calculated as ‘Off-Target’ as a first step to being declared Non-Conforming
iii. and there may well be Compliance implications at the AER as well.
iv. not to mention Regulation FCAS cost implications, depending on what the particular proxy for frequency said.
Finally, we see Ramp Profile #4 can be drawn in with reference to the 60 x sequential 4-second SCADA snapshots** taken through the dispatch interval.
** notwithstanding the simplification that the timestamps are added when AEMO receives these snapshots, not when they are taken.
(a) This ramp profile is used in the apportionment of Regulation FCAS costs;
… along with the (different) proxy for frequency used ….
(b) Which is particularly topical at this point, given there’s only ~9 weeks to go before the method changes:
i. From (the flawed) ‘Causer Pays’ method
… that’s currently utilised in ‘Games that Self-Forecasters can play’ …
ii. To (an improved) ‘Frequency Performance Payments’ method
… though readers should remember that FPP is about more than just Regulation FCAS costs!
Note that the ‘Unit Dashboard’ widget in ez2view is designed to show Ramp Profile #1 (with Ramp Profile #2 being implicit) and Ramp Profile #3.
We’ll come back to this article in subsequent articles.


Leave a comment