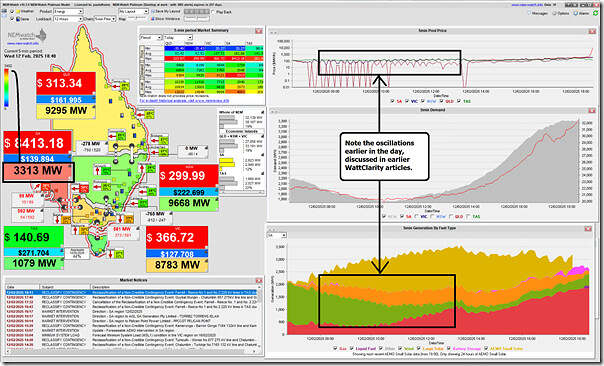
We had earlier posted that today ‘… could be a big day for ‘Market Demand’ in South Australia’, with ‘Market Demand’ potentially as high as 3,200MW as noted in that article.
Update as at the 18:35 dispatch interval
Well, here’s a snapshot from NEMwatch at the 18:35 dispatch interval (NEM time) showing ‘Market Demand’ up at 3,313MW:
Notes:
1) With respect to this particular dispatch interval:
(a) The demand is well up in the ‘red zone’ relative to historical range
(b) Specifically, with respect to this >17 year history of SA daily peak demand we see that this level:
i. Is highest since Monday 31st January 2011; and
ii. Is the 4th highest since 1st January 2008;
… but note it may still go higher
(c) Also note the price has jumped above $8,000/MWh
(d) Because of the fuel mix in play (including low wind generation), and constrained interconnector flow over VIC-SA*; and
* which, as reinforced in a conversation earlier today, should not be really called ‘Heywood’ for a while because of the added ~150MW capability of PEC Stage 1.
(e) And also note that the IRPM of the SA-only ‘Economic Island
2) Also noted on the image is clear evidence of the oscillations:
(a) In both prices, and also dispatch outcomes
(b) Which were discussed in these articles
(c) And appear to be due, at least in part, by a rogue Murraylink term on the RHS of a particular (new) constraint equation.
Update at the 18:55 dispatch interval
The ‘Market Demand’ has reached 3,327MW.
Updates at the 19:00 and 19:20 dispatch intervals
See the subsequent article ‘Spare capacity in South Australia drops below 100MW on Wednesday evening 12th February 2025’.


Leave a comment