This post follow’s Paul’s post from Wednesday 23rd August, summarising the power system challenges brought by intermittent solar PV.
I sent Paul a brief follow-up reply, and he suggested we add it as a post on WattClarity. I’ll briefly delve into the low solar output event across the NEM on Friday 19th May 2017, which seemed somewhat eclipse-like, as Paul points out in his post. Paul’s initial thought of “potential data error” (regarding the AEMO data included in the NEM-Review plots) triggered me to take a quick look, too.
For background, I’m a Co-Founder in a solar forecasting service Solcast along with Dr Nick Engerer, who authored a post on WattClarity earlier this year. I’m also a former Meteorologist. Nick and I started Solcast to assist with the integration of increasing solar PV into power grids, in association with a research project at the ANU led by Nick.
Solcast operates a global solar PV modelling and forecasting system. In areas with satellite coverage (like Australia), the system updates its forecasts every 10 or 15 minutes on an approximately 1-2km grid, using a range of empirical and dynamical techniques. When combined with metadata of individual installed PV systems, regulatory data on installations, and a few other elements, the system produces estimated actuals and forecasts of individual and aggregate PV output.
One such aggregate that we track is the NEM-wide PV power output, the same aggregation unit used by Paul in his post. For the 19th May, Solcast’s actuals data showed a similar NEM-wide total daily production, just over 5,000MWh. QLD never gets above 300MW, and NSW barely passes 200MW. We sometimes see daytime dips to these levels for a few hours, however it’s very rare to see QLD and NSW as low as this for an entire day. For SA and VIC, days like this are more common, but as Paul has pointed out, it’s the NEM-wide spread that’s most notable here.
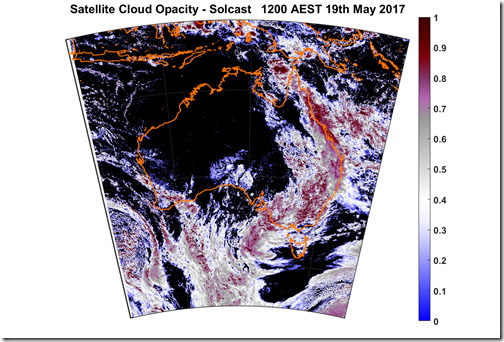
We were interested enough to pull out some data for that day – here’s a plot of cloud opacity (optical thickness) at midday AEST on 19th May, derived from the satellite imagery plus a handful of other information sources, including PV data. The cloud situation was very similar all day.
This kind of comma-shaped band of cloud is relatively common over eastern Australia, when you have moisture from the Coral Sea area feeding into a trough with a low-pressure system near SA or VIC.
In this particular case of 19th May, the band of cloud happens to cover most of the populated areas of the NEM, and the cloud is very thick over a large area. Being a widespread and slow-moving cloud feature, it shows up as a significant outlier in Paul’s daily aggregate graph, since it lasted most or all of the day over most of the NEM’s installed rooftop PV.
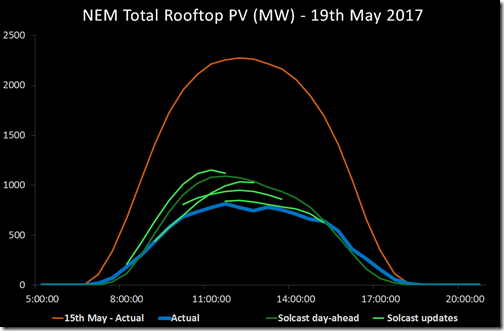
We also took a quick look at our PV forecasts for 19th May, to check our model was capturing the situation. Here’s a summary plot, showing our NEM-wide actuals and forecasts (day-ahead, plus a few of our 10-minute-updated short-range forecasts as issued on the day). To give a sense for the scale of the event, also plotted are our NEM-wide actuals for 15th May, a relatively cloud-free day during the week prior.
The forecasts captured the event well, which is unsurprising given the cloud event was large and slow-moving. During the morning of the 19th, our forecast updates started similarly to the prior day-ahead view, then gradually and slightly downgraded, very closely matching the actuals by late morning. This forecast ‘hit’ is just the kind of ego-boost we need, as our algorithm development focuses on some much trickier cloud situations like afternoon convection and tropical cyclones.
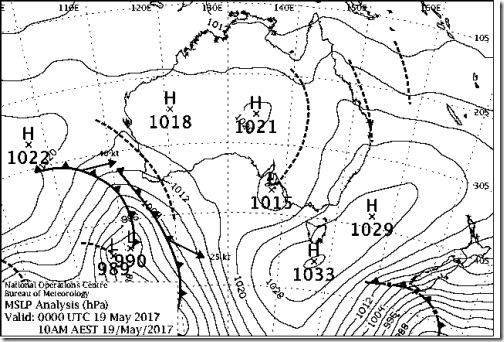
For those interested in the meteorology of this event, here is the BoM’s surface analysis chart from 10am AEST on 19th May – two hours prior to the cloud image shown above.
The surface chart shows a weak trough of low pressure extending from a weak low-pressure system off the SA coast. At first glance this system is unremarkable, however it’s the remnants of a deeper low-pressure system that formed ahead of a pool of cold air in the upper atmosphere off the southwest WA coast almost a week earlier.
The cold pool and low-pressure system pair had separated from the general Southern Ocean westerly flow, and hence were tracking very slowly (taking four days to get from Perth to Adelaide, for example). This slow movement allowed the system to gradually draw in large amounts of moisture from north of Australia, leading to the thick and widespread cloud that we saw over eastern coastal Australia on the 19th.
About our Guest Author
 |
James Luffman is (with Nick Engerer) a co-founder of Solcast, a solar forecasting company.
James is a former Meteorologist. Solcast delivers operational solar energy modelling and forecasting technologies, based on a fusion of unique and disparate data sources You can view James’ LinkedIn profile here. |


As has been observed previously, “We should start by noting that no-one actually KNOWS, in aggregate, how much small-scale solar PV systems are injecting into the NEM (or indeed in any grid).” (https://wattclarity.com.au/2016/06/the-opacity-of-distributed-small-scale-solar-pv-output/). Given this, how actual are the ‘NEM-wide actuals’? Isn’t this this more just one model converging with another?
Thanks James, very intertesting