It has been with interest that I have watched (as an outsider) as the takeover bid made my Thailand’s Banpu for Centennial Coal has progressed.
A. About the Two Parties
My understanding is as follows:
1) About Centennial
Centennial Coal was established as an organisation in 1989 to contain the coal mining operations supplying many of the coal-fired power stations in NSW. It was listed on the ASX in 1994 (around the time that the first interim electricity market was introduced in NSW as a precursor to the NEM).
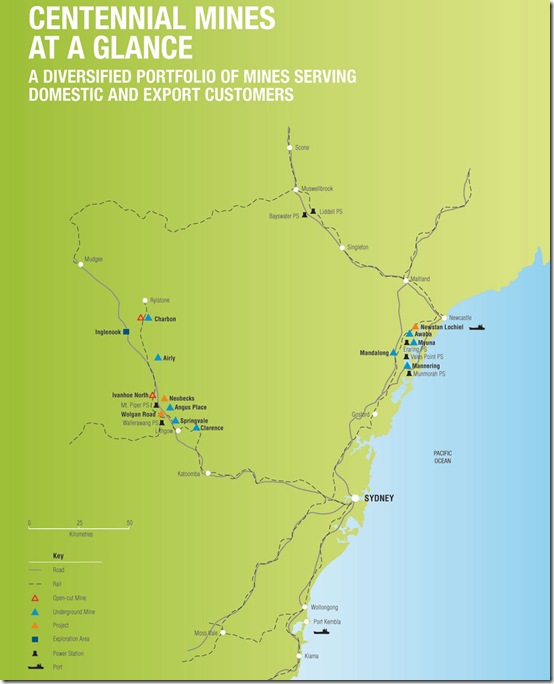
The following map (which has been obtained recently from the Centennial website here) provides an overview of Centennial’s operations.
On 6th August 2002, Centennial acquired the Powercoal portfolio of mines from the NSW Government at a price of $331M.
This provided Centennial with a significant increase in scale of operations, and significantly expanded Centennial’s share of thermal power supplied into the NEM (indeed, prior to that acquisition I’m not sure if Centennial Coal supplied any coal to power stations in the NEM).
The contracts Centennial Coal now has in relation to the NEM (with an average expiration date of 2014) are in relation to three different groups of assets:
(a) The Eraring Power station on the central coast, owned by Eraring Energy;
(b) The Vales Point and Munmorah power stations on the central coast, owned by Delta Electricity – and currently proposed to be grouped together under one “gentrader” package in the privatisation process;
(c) The Wallerawang and Mt Piper power stations in the Blue Mountains – owned by Delta Electricity, and proposed for the second of two Delta “gentrader” contracts.
2) About Banpu
My understanding is that Banpu began operations in 1983 as a coal-miner (in Thailand), but diversified into power generation in the 1990s – plus other ventures. Since 2001 it has reversed some of this diversification and has focused on growing its business as a coal miner across the Asia-Pacific.
There is an English-language section of the Banpu website here.
B. About the takeover offer
I have only had a small amount of time to gather together this background, and have not considered in any detail:
1) From Centennial
On 5th July 2010, Centennial announced that Banpu had agreed to make an offer of A$6.20/share (in cash) for all the shares that they do not already own (at that time, their stake was 19.9%).
The Board of Directors have recommended shareholders accept the offer, in the absence of a better bid from someone else.
Centennial has provided this page on their website as a temporary link to provide for more information.
2) From Banpu
On 16th June the company announced it had purchased an additional 5% of the shares in Centennial (at $4.95 per share).
On 25th June the company noted it would only make comment about its investment in Centennial via the Stock Exchange of Thailand. No further
Since that time, several notices have been made to the Stock Exchange of Thailand.
3) In the Media
In the following tables, I have tried to provide a quick summary of the news reports I have seen in the media about the takeover process. It is not meant to be a comprehensive summary – just to illustrate my level of background, in preparing this analysis.
I have partitioned the table on a week-by-week basis to provide more context.
Monday 5 July The AFR reported that the bid had been made. The SMH also reports the bid, noting that the resolution of negotiations over the resources tax provided enough certainty to allow the bid to be announced and accepted.
Tuesday 6 July The Australian echoed the story about the takeover being an early winner from the compromise on the MRRT. The story also notes Banpu’s strategy of increasing coal prices to export parity prices as existing contracts roll off. The AFR notes a similar story, including that some of the coal supplied domestically is supplied at prices as low as $25/tonne.
The Newcastle Herald also reported a similar story. This article mentions that the NSW Government has already assigned the Cobbora open-cut coal resource for future domestic use as part of the plan to address the upwards pressure on prices.
Wednesday 7 July The AFR reports that Banpu plans to issue bonds as part of its plans to fund the bid. Thursday 8 July Friday 9 July Comment is made in the AFR about coal price rises being another factor pushing electricity prices higher (this is my main area of interest, and is related to my initial post here). After a busy first week, the media quietened down:
Monday 12 July Tuesday 13 July Wednesday 14 July Thursday 15 July Friday 16 July Similarly, the following week was quiet:
Monday 19 July Tuesday 20 July It was noted in the Australian that Banpu had received approval from the Bank of Thailand to remit foreign currency to pay the consideration under the (all-cash) takeover bid. Wednesday 21 July Thursday 22 July Friday 23 July Last week, however, the takeover is back in the news:
Monday 26 July The AFR reports that Banpu has withdrawn the application to the FIRB, citing the federal election as the reason. The Australian reported that Banpu had (in its withdrawal note) indicated that it would re-lodge its FIRB application to give it more time to gain approval, given the election.
Tuesday 27 July Wednesday 28 July The Australian contained this article that did not add significantly to the information already in the public domain (at least from the perspective of what it means in the NEM – and hence to Australian east-coast electricity users). Thursday 29 July Friday 30 July This current week coverage has been scant:
Monday 2 Aug The AFR reports that Banpu has withdrawn the application to the FIRB, citing the federal election as the reason. The Australian contained this article summarising the history of Centennial Coal. It notes that FIRB approval is not expected before the federal election.
Tuesday 2 Aug Wednesday 3 Aug (today) Thursday 4 Aug (tomorrow) Friday 5 Aug This background should provide some context to the discussions below.
C. Centennial Coal and the NEM
Even prior to the Banpu offer, Centennial had talked of one of its key drivers being the growth of its profit margin as current domestic thermal contract tonnages progressively roll off, and are re-priced at (or close to) export parity prices.
Whilst it is logical for Centennial Coal (or any fuel supplier) to seek to maximise the revenue earned from its product over time, such an approach does potentially have implications for the NEM – which are discussed below.
Through the use of NEM-Review 6, we have prepared the following analysis in order to provide some background to the implications of such a strategy on the NEM.
In all of the analysis below, the simplifying assumption has been made that Centennial Coal has supplied (over the past 10 years) 100% of the coal consumed at the five stations under consideration. This is not a true assumption (even though Centennial Coal is the largest supplier):
1) Annual Station Spot Revenues
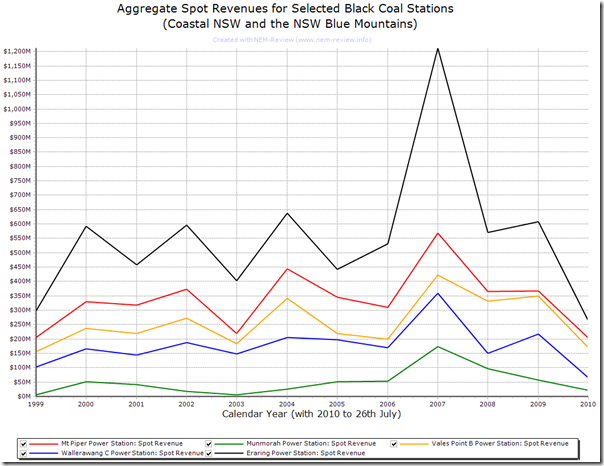
The following chart provides an illustration of approximate annual spot revenue earned from each of the five power stations for each calendar year:
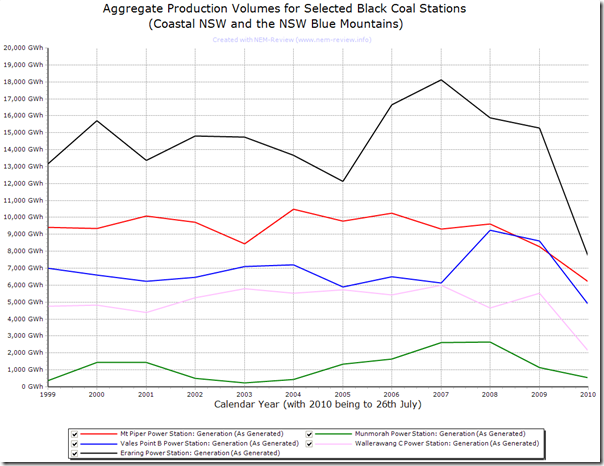
The spot revenue is calculated only approximately as generation volumes “sent out” (i.e. net of energy used onsite) are currently confidential and not published by AEMO, the market operator. Hence these are estimated from “as generated” values, which are shown below and combined with half-hourly spot prices and marginal loss factors to calculate revenues.
In addition, the chart above does not take into account revenue earned through the contracting strategies employed by Eraring Energy and Delta Electricity (the two companies that have owned these assets over the period shown).
However, the numbers will be sufficient for the purposes of high-level illustration.
2) Annual Station Production Volumes
The following chart provides an illustration of annual production “as generated” from each of the five power stations for each calendar year:
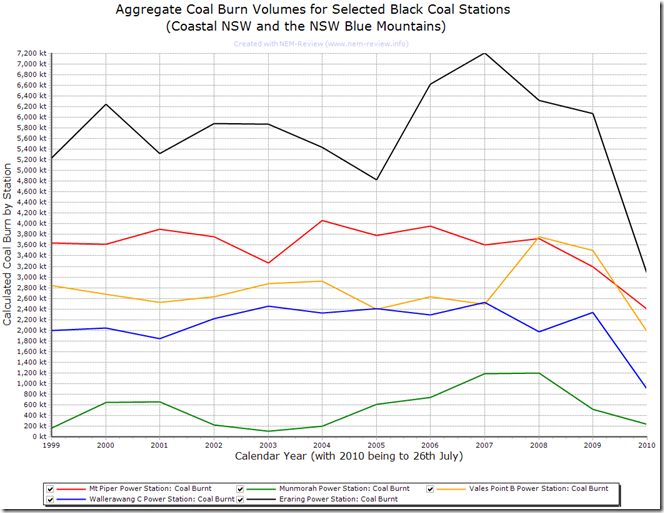
3) Annual Coal Burn
The following chart provides an illustration of approximate annual coal burn from each of the five power stations for each calendar year:
4) Annual Average Revenue per Tonne of Coal Burnt
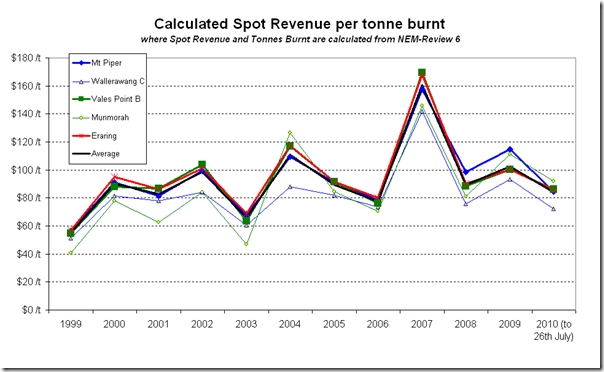
By combination of the data derived from NEM-Review (above), we can produce the following chart, which provides a view of the average (across each year) revenue earned by the station per tonne of coal burnt.
In this chart we have adopted colour coding according to the 3 bundles of power station assets supplied by Centennial Coal. Smaller lines are used to depict the more marginal assets.
It’s been noted in many locations how the export price of thermal coal has risen significantly in recent years, and has been significantly more volatile than in the past.
Spot prices around $100/tonne were seen at the Newcastle port in early 2010 – whilst ABARE reports (p13) that the average export price was above $80/tonne for the March quarter.
There are a number of reasons why Centennial Coal would not be anticipating prices that high – these would include:
(a) Consideration that the power stations would not require coal to be washed, unlike the export buyers for the thermal coal;
(b) Lower transport costs for the coal – especially when mines are located adjacent to the power station;
(c) Benefits of long-term contracts over spot pricing;
(d) Avoidance of currency risk in supplying to Australian generators; and
(e) Low credit risk in supply to generators that are owned by the state government.These factors (and more) will act as a brake on price expectations. However, quoted export prices do reinforce a general perception that there is a mismatch between export thermal prices, and long-run domestic prices.
The chart above provides a clear indication of the size of the challenge that these generators would have faced, in recent historical years, if their coal supply prices had been at those levels.
5) Cost of Coal Burnt as a proportion of Revenue Earned
It should be noted that the chart above uses the total spot revenue earned by each of the 5 stations.
For the power station to be a viable business, this revenue would need to (at least on average) cover all of its costs, and provide for an adequate return.
The cost of coal (even now, at the existing rates) will constitute a significant proportion of these costs – but there are other significant costs, including:
(a) Other costs that contribute to a generator’s short-run marginal cost of operations, plus
(b) Costs that contribute to a generator’s long-run marginal cost of operation – such as interest on debt, and desired return on equity.As such, there is no allowance made for this revenue to cover any of the other costs incurred in the generation of the production volumes noted. Such costs include the costs of operations and maintenance, plus large costs associated with the cost of interest on debt, and a rate of return on capital invested.
Due to time constraints I am not able to fully extend this analysis by considering those costs contributing to these generator’s long-run marginal cost.
Rather, an estimate of each generator’s cost operations and maintenance (O&M) has been subtracted from the revenue figures illustrated above to provide a clearer view of the remaining revenue contribution available to provide for both:
(a) Fuel cost; and
(b) Interest on debt plus return on equity.In the interests of transparency, we have chosen to use the estimates of O&M cost provided for each of the 5 power stations in the most recent ACIL Tasman document:
ACIL Tasman. April 2009. “Fuel resource, new entry and generation costs in the NEM”
located at http://www.aemo.com.au/planning/419-0035.pdfIn this document, estimates are provided for both of the following:
(a) The Variable Operations and Maintenance (VOM) cost; and
(b) The Fixed Operations and Maintenance (FOM) cost.
These costs have been transcribed into the following table:(a) Variable O&M (VOM)
On page 14 of the document, VOM is defined as:
“additional operating and maintenance costs for an increment of electrical output … wear and tear … between scheduled maintenance”
and
“OM includes additional consumables such as water, chemicals and energy used in auxiliaries and incremental running costs such as ash handling”The data quoted for each of the 5 stations is as follows:
VOM (sent out) Aux Factor VOM (as gen) Mt Piper $1.32/MWh 0.95 $1.25/MWh Munmorah $1.19/MWh 0.927 $1.10/MWh Vales Point $1.19/MWh 0.954 $1.14/MWh Wallerawang $1.32/MWh 0.927 $1.22/MWh Eraring $1.19/MWh 0.935 $1.11/MWh i. VOM numbers from Table 12ii. Auxiliary Factors from Table 12I have converted this cost to an as-generated basis, as this is the way in which I chose to have NEM-Review calculate the production volumes above.
As noted above, this “VOM (as gen)” figure was then translated into an annual cost with reference to the annual production in that year.
(b) Fixed O&M (FOM)
On page 14 of the document, VOM is defined as:
“FOM represents costs which are fixed and do not vary with station output, such as major periodic maintenance, wages, insurances and overheads”
The data quoted for each of the 5 stations is as follows:
FOM Capacity FOM Mt Piper $49,000/MW/yr 1,320MW $64.68M p.a. Munmorah $55,000/MW/yr 600MW $33M p.a. Vales Point $49,000/MW/yr 1,320MW $64.68M p.a. Wallerawang $52,000/MW/yr 1,000MW $52M p.a. Eraring $49,000/MW/yr 2,640MW $129.36M p.a. i. FOM numbers from Table 12ii. Capacity numbers from Table 6This Annual FOM cost was added to the variable cost (above) to compute a total O&M cost in each year.
Note that these are estimates in current day dollars, so we have taken considerable liberty in applying these numbers up to 10 years back into the past – we believe that the numbers produced are accurate enough to illustrate the main implications (outlined below).
6) Annual Average Net Revenue per Tonne of Coal Burnt
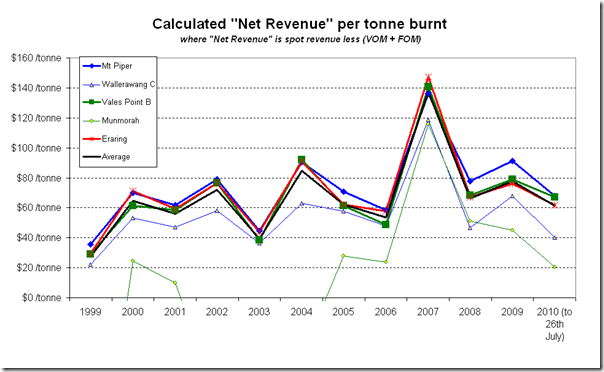
The figure for total O&M cost in each year has been subtracted from the total revenue to produce a figure which we’ve called “Net Revenue”.
This Net Revenue has then been apportioned over the same coal burn figure for the year to produce this final chart – which is similar in pattern to the one above, though with some significant differences. It can be noted, for instance, that the net revenue figure for Munmorah station (the most marginal of the 5) is shown to be significantly negative in some years, and much lower in others.
Hence, this chart provides a representation of the revenue remaining to pay for the following:
1) The cost of coal supplied;
2) Interest on debt;
3) Return on equity.It should be stressed that these calculations are approximate only, and have been performed only to provide an indication of the scale of the challenge – should coal contract prices trend upwards.
7) Source File, for Further Analysis
For those who wish to perform additional analysis with the data shown here, we have uploaded the .NRF file to this location.Just download the linked file, unzip, and double-click to open in NEM-Review 6 – then enjoy!
D. Potential Implications for the NEM
In the light of the above considerations, the following appear to be potential implications.
It’s worth noting, however, that Centennial’s stated strategy (even without the takeover) has been to progressively reduce its exposure to the NEM as current contracts expire – or at least to price closer to export parity. Hence these implications would be the case even without the takeover:
1) Higher spot prices
First, it should be note that (all else being equal) higher coal costs charged to the five generators identified above would result in higher electricity spot prices in the NSW region – and further throughout the rest of the NEM.
Complex modelling would be required in order to confirm that a rise would occur (and to understand its magnitude). If modelling were to be performed, the modeller would be required to make a number of substantial assumptions about how other elements in the market would respond (other fuel suppliers, other generators, and the demand side).
At this point in time, it is sufficient to note that the impact could be significant.
2) Valuation of the “Gen Trader” contracts
Currently the NSW government is looking to privatise some elements of the electricity supply chain in NSW. It is proposed that the trading rights to the five stations noted above are bundled together into three “Gen Trader” contracts.
Fuel supply costs would have a significant impact on the profit potential of these contracts, and hence the revenues the NSW government would earn through their sale.
This consideration would be just one of the reasons that the NSW government has previously acted to encourage the generation companies to pursue options for a new mine for the Cobbora coal resource.
3) Changing Asset Mix
Coupled with considerations of the valuation of the Gen Trader contracts is the consideration of the extent to which step changes in coal pricing would have the effect of accelerating the closure of older, less efficient (and more marginal) generators – such as Munmorah and Wallerawang.
Obviously, any predictions about this occurring are predicated on the twin assumptions that:
(a) New coal pricing offered by Centennial Coal are uneconomic for the generators in question; and
(b) Cost of supply from any other option (including, but not limited to, the Cobbora deposit) are also uneconomic.These are significant assumptions, and this article should not be taken to imply that we believe this will occur – just that it is a potential implication.
4) Carbon Emissions
One other implication of such changes (if they were to occur) would be that the overall emissions intensity of electricity supplies in NSW would presumably decrease, being driven down by the lower emissions intensity of whatever plant built to supply the power formerly supplied by the closed stations.



Leave a comment