We appreciate the opportunity to work with Energy Consumers Australia to provide what’s alternatively known by a wide group of people as the “ECA widget” or the “NEMwatch widget”.
| On this page we’ve linked to answers to some of the most commonly asked questions we receive about this widget
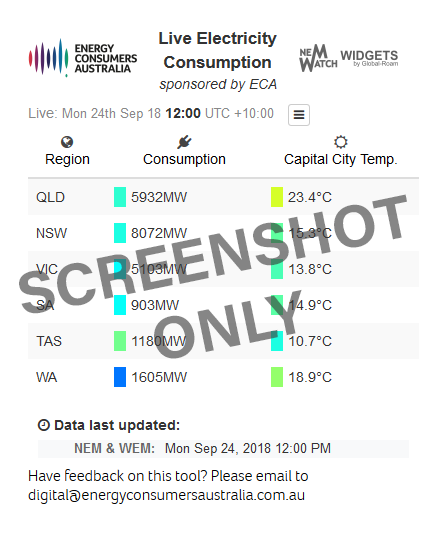
Here’s a smaller view of the widget, which you will note collapses down into a smaller table view, focused on capital cities |
 |
If you embed it as a full screen widget (and view it on a large screen) you’ll see a map view:
Measuring Electricity Demand
Measuring electricity demand (especially in real time) is not as easy as one might expect. On 24th April 2018 we posted this detailed explainer about electricity demand.
Power Grids
This NEMwatch widget shows the current rate of electricity consumption demand balance across Australia’s two main electricity grids:
1) In the east, Australia’s National Electricity Market (NEM) covers only ½ of the Australian land-mass but accounts for roughly 90% of electricity consumed across the country.
2) The second major grid is the South-West Interconnected System (SWIS) that supports Wholesale Electricity Market (WEM) which supplies the cities of Perth and Freemantle, and surrounding areas of south-western WA. Note that this does not cover the whole of WA (there is a sizeable grid in the North-West, for instance), but it is the only data we have access to at this point.
3) We’re aware that the widget does not provide visibility of the main grids in Northern Territory (and other remote grids, such as Mt Isa). If data does become available for them, we would seek to include them.
Cadence, Timestamps, and Data Points
The widget shows data aggregated together from several different providers – so the data has slightly different cadence and timestamps. We have designed the widget to show the most current data available – you can mouse-over a data point in the widget to understand more.
The following table provides a few pointers about different data:
In Western Australia
(The WEM operates in local Perth time, which is UTC + 8 hours)
| Temperature Data | Data for the temperature points provided in the widget is sourced from the Bureau of Meteorology. |
| Demand Data | Data for most of the fuel types is supplied by the AEMO West (formerly the IMO) and is of a 30-minute cadence. Being an isolated grid, supply always equals demand in the SWIS. |
Across Queensland, NSW, Victoria, South Australia and Tasmania (the NEM).
(The NEM operates in Eastern Standard Time (UTC + 10 hours) and does not shift with daylight savings. Hence for clarity it is known as “NEM time”)
| Temperature Data | Data for the temperature points provided in the widget is sourced from the Bureau of Meteorology. |
| Demand | In this widget we choose to use the AEMO field “Demand and Non Scheduled Generation” as the closest proxy they publish in real time to “Operational Demand” |
All data is shown as close to your current viewing time as possible.
If you have more questions?
If you have more questions about this widget, please drop us a line using this feedback form, remembering to provide us a phone number we can reach you on if we have questions about your suggestions.

