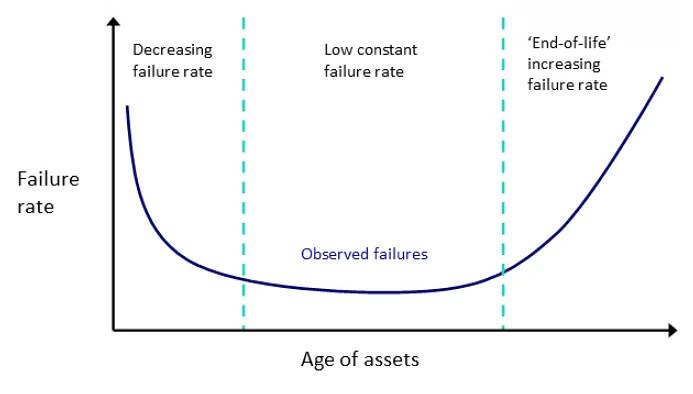
The term ‘bathtub curve’ is the name given to describe a typical trend of forced outage rate across the life of a generation asset. It was historically used when referring to the typical life of a thermal generation asset, which would consist of:
1) Increased forced outages at the start of the life of the asset, as teething issues are ironed out;
2) Lower for many years during the period of normal operation;
3) But climbing again towards the end of life as the unit grapples with the chicken-and-egg dilemma of:
(a) Diminishing remaining commercial life, so reduced incentive to invest in maintenance, hence reducing availability;
(b) Compounded by the reduced availability potentially leading to decisions to retire the unit sooner.

A typical ‘bathtub curve’ of failures/outage rate of a generation asset or assets.
Source: Energy Networks Australia
Some prior articles on WattClarity have been tagged with ‘bathtub curve’.

