

Was titled ‘Aggregate ‘Dispatch Error’ (across all Semi-Scheduled Wind Farms) increased during the recent heatwave‘, but that was a bit too nerdy (obscure).
———
A conversation today amongst our broader cohort about the heatwave earlier this month had me scurrying to the ‘Trends Engine’ in ez2view to produce the following macro view of ‘Dispatch Error’ across the entire* Wind Farm fleet NEM-wide:
* in this case, by ‘entire Wind Farm fleet’ I mean the Semi-Scheduled units, as they are the ones for whom a Target is given. That leaves off a couple smaller wind farms (and a big one as well) that remains Non-Scheduled.
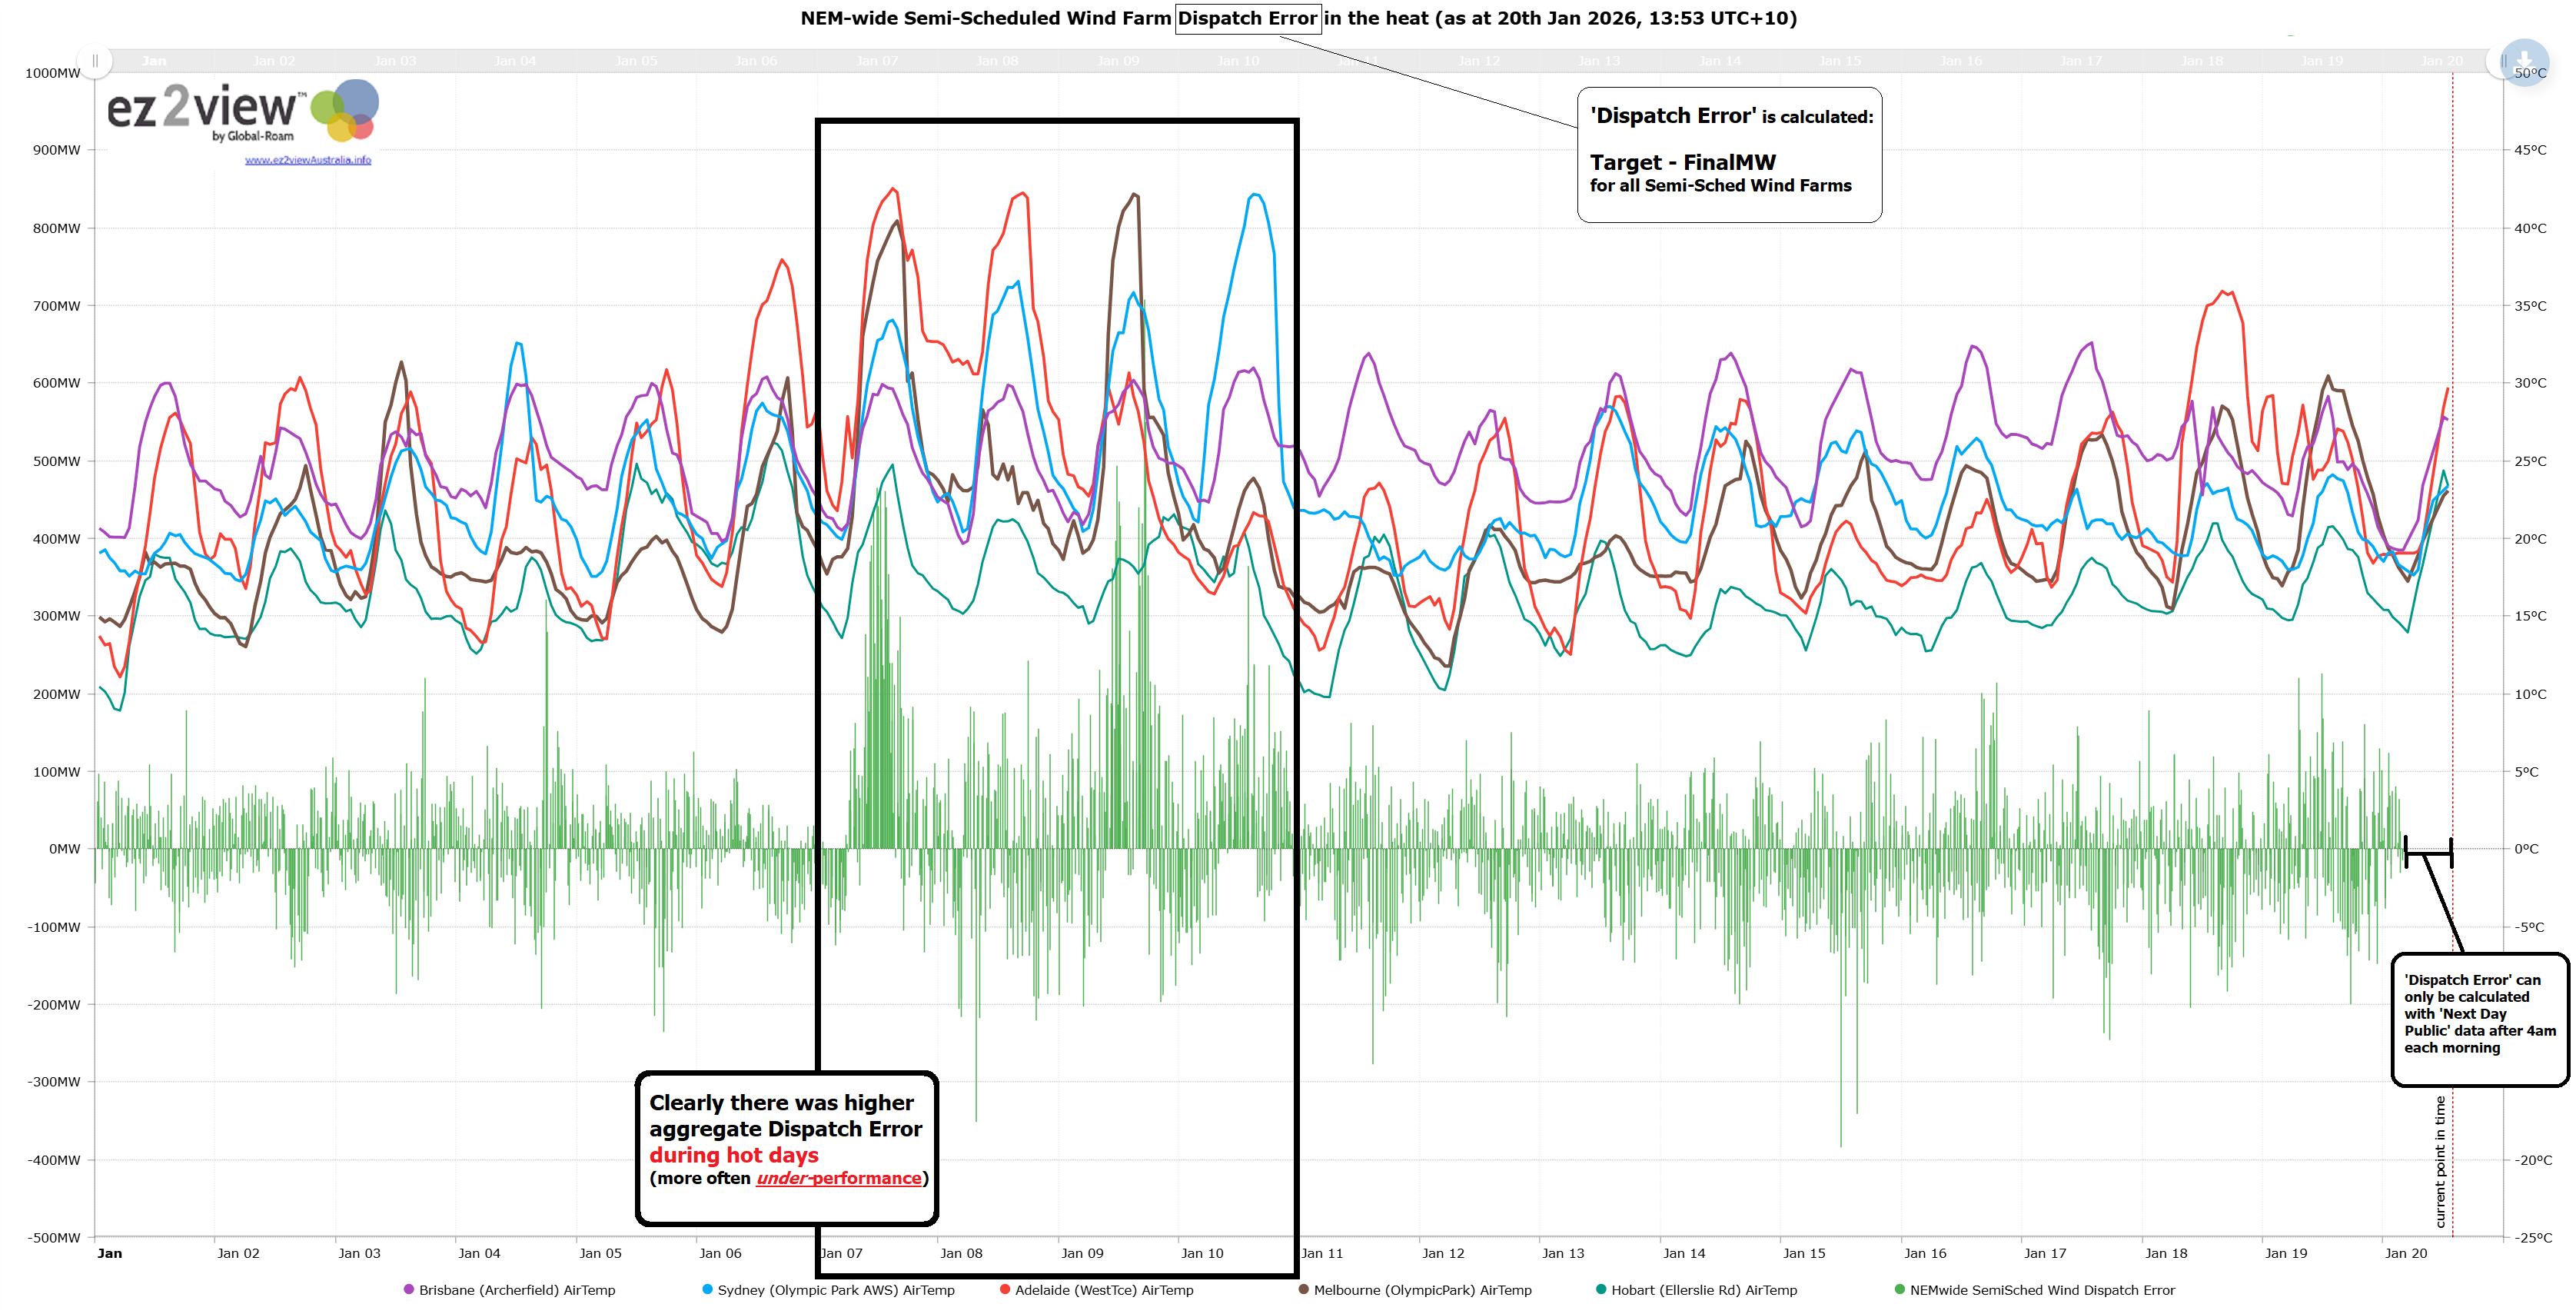
Understanding that ‘Dispatch Error’ is calculated as ‘Target – FinalMW’ that means that:
1) A positive number represents under-performance compared to Target
… or some might think of it as over-optimistic forecasts!
2) Whereas a negative number represents over-performance compared to Target.
I don’t have much time at present, but just want to leave this here with three key observations/recollections:
1) We’ve already noted many times that the one-sided nature of the Semi-Dispatch Cap arrangements mean that under-performance is much more prevalent than over-performance
… the trend above includes all Semi-Scheduled wind farms, no matter what each unit’s SDC status was.
2) In the 20-day time range for January 2025, we can clearly see that ‘Dispatch Error’ (and specifically under-performance) was consistently larger on the hot days:
… specifically looking at:
(a) Wednesday 7th January 2026, with the heat particularly affecting in SA and VIC;
(b) Thursday 8th January 2026, with high temperatures particularly in SA and NSW;
(c) Friday 9th January 2026, with high temperatures particularly in VIC and NSW;
(d) Saturday 10th January 2026, with high temperatures particularly in NSW.
Long-time readers might recall that we’ve written about high temperature effects on occasions before:
1) Back in summer 2019-20 we wrote ‘Extreme temperature effects on generation supply technology’
(a) That was a long article
(b) Which referenced the GRC2018 and also the GSD2019 to highlight the impact on different types of technology
2) Some readers might also recall the way in which many readers (perhaps themselves) were unable to correctly guess ‘Which was that ‘mystery DUID’ that apparently ‘can’t stand the heat’*?’
(a) the answer was a Wind Farm!
(b) and there’s clear illustration of that also in the trend chart above.
It’s now 6 years later and we’re days away from the release of the GSD2025 … when that’s released, one of our team might see if they have time to explore the January heatwave in more detail.

RE : wind farms dont like the heat… Not sure that is explained correctly.
Are you sure it’s not the air density that is lower during hot conditions that leads to reduced output from the wind turbines – I’d be surprised if their components care about being hot…
As a aviation pilot , hot weather doesnt bother the engine but the lower air density can double our runway requirements….
very cool blog!! Excellent .. Amazing ..I am happy to find a lot of useful information here in the post, thanks for sharing
Air density
Fan forced cooling in nacelle for gearbox oil & electrical components (or feathering of blades to reduce output)
Reduced electrical efficiency at high temps
Air density
Fan forced cooling in nacelle for gearbox oil & electrical components (or feathering of blades to reduce output)
Reduced electrical efficiency at high temps