The milestones are coming thick and fast in the National Electricity Market these days – some much remarked on (such as declining minimum demand … perhaps again this Sunday, and the release of the ESB’s Final Advice to Energy Ministers) … but also some that have slipped under the radar.
For instance, today (Friday 17th September) marks 4 weeks past the first year anniversary of commencement of publication of MT PASA DUID Availability data, following the ERM-sponsored Rule Change passed on 20th February 2020.
(A) Quick notes about these milestones
So in today’s article, we have a look at tying some of these threads together…
(A1) About the ESB’s Final Advice
In the ESB’s Final Advice, there seems to be two different aspects that relate (somewhat) to the real data we can start seeing come through with the MT PASA DUID Availability data… (though alas only 1 year of history at this point).
(A1a) Under ‘Resource Adequacy Mechanisms’
Chapter 3 in Part A of the ESB’s Final Advice speaks about ‘Resource Adequacy Mechanisms and Ageing Thermal Retirement’.
In case you’ve been concentrating elsewhere for a while, this is the source of much of the angst has arisen across a number of NEM stakeholders – with the proposal dubbed (by some) as ‘Coal Keeper’.
In chapter 3 (p26/54) of Part A the ESB writes:
A new capacity mechanism
A detailed straw proposal for a capacity mechanism, based on a certificate scheme, has been developed by the ESB and is detailed in Part C of this report. This could form the basis of a starting point for further design work. The straw proposal is a decentralized capacity mechanism in that the volume of required capacity is determined by liable entities (market participants) who would be required to hold a certificate position to cover their actual demand.
In the straw proposal for the physical retailer reliability obligation (PRRO):
• certificates would be allocated to resources, based on their expected ability to be available to generate during ‘at risk’ reliability periods. As a new tradeable product, its complementary revenue stream will provide an investable and enduring signal that more directly targets the needed capacity for timely entry and orderly exit. The forward value of certificates would reflect any perceived risks of scarcity (high prices) for capacity.
• certificates would value both existing fleet and new investment in assets that are best placed and most cost-effective in responding to shortfall period.
• requiring liable entities to hold sufficient physical certificates to meet demand during a predefined period provides a ‘line of sight’ between demand and physical supply, providing transparency and confidence that demand will be met. Participants would continue to be incentivised to manage their financial risk in the spot market through financial contracts, making the straw proposal an ‘adjunct’ to the current market.
This ‘straw proposal’ centres on making the existing RRO more physical in nature (hence the PRRO). For those, like me, who might need a refresher on how the (existing, not-so-explicitly-physical) RRO works, Allan’s article from 13th January 2020 might be useful.
It should be noted that is but one of the options that the ESB envisages – with the recommendation seeming to imply ’all the details are up in the air’: (chapter 2 of Part A – p19/54):
2. To support timely entry and orderly exit of resources in the NEM for 2025 and beyond, the ESB recommends Energy Ministers agree to a further initial reform:
a) provide in-principle support for a capacity mechanism for the NEM to ensure the competitive provision of the right mix of resources as the market transitions towards net zero emissions. This mechanism will ensure investment in an efficient mix of variable and firm/flexible capacity that meets reliability at lowest cost and increase government and community confidence that resource adequacy will be delivered by the market reducing the need for interventions.
b) In recognition of significant stakeholder concerns, instruct the ESB to work with stakeholders and jurisdictions over the next 12-18 months to develop the detailed design of the capacity mechanism for the agreement of Ministers in mid-2023. There are a number of policy choices in the design of a capacity mechanism, as set out in this advice, which need to be considered to ensure the recommended design is both effective and efficient.
c) a decentralised capacity mechanism (where the volume of required capacity is determined by liable entities, such as the Physical Retailer Reliability Obligation set out in this advice) should be the starting point for the design work. Further consideration should also be given to:
i. whether it would be preferable to centrally determine the volume of required capacity;
ii. whether using existing contracts between registered market participants would be preferable as the basis of the scheme (rather than creating a new certificate);
iii. how to best address the impacts of the proposed capacity mechanism on retail competition (including small retailers), commercial and industrial customers market power concerns, transaction costs for market participants, and affordability; and
iv. integrating a NEM-wide, common approach to jurisdiction investment schemes to work alongside the new capacity mechanism
Leaving aside this massive wiggle room in ‘final’ advice, we’ve been thinking about how a capacity market would map into existing data structures … and vice-versa (i.e. what can the recently added data structures do to help inform these market reform considerations) …
(A1b) Under ‘Scheduling and Ahead Mechanisms’
Chapter 4 in Part A of the ESB’s Final Advice speaks about ‘Essential System Services and Scheduling and Ahead Mechanisms’
With all the fuss created by Chapter 3, and also another fuss about the never-say-die proposal for nodal prices and FTRs (in Chapter 6), this chapter seems to have generated almost no commentary?
In chapter 4 (p32/54) of Part A the ESB writes:
Operating Reserves
Currently, operating reserves have been provided by generators implicitly, by generators who keep some of their ‘spare’ capacity in reserve to manage their risks in the energy market. That is, they use their reserves to ‘ramp up’ for unplanned system development or respond to high prices. Demand response can also provide this sort of reserve. This un-dispatched capacity that is made available by market participants in the wholesale market can act as ‘in market’ reserves (a buffer for the system) and be drawn upon by AEMO as part of various market and regulatory arrangements; however, they are not specifically provided for through a mechanism or market.
The costs of providing these operating reserves are part of the cost of providing energy, that is, they are ‘bundled together’. Without a separate and explicit signal for their provision (that is, ‘unbundling’ them from the value of energy), the level of operating reserves available to the system is dependent on the commercial obligations of market participants. Investment in reserves is a commercial decision by generators to maintain spare capacity within their portfolios to ensure they can meet their commercial obligation. While commercial drivers are a key reason participants invest in spare capacity to begin with, how participants make this capacity available to the market depends on a number of incentives in the current arrangements. Generators offering in more supply, or consumers reducing their demand, can be rewarded if this capacity is called upon.
The increasing variability and forecast uncertainty of supply and demand that comes with a transitioning fleet, the wide range of power system challenges that can come with extreme weather, and the integration of new technologies and combinations of resources into the power system, suggest the potential need for reserves is increasing. Or rather the changing generation mix may mean that the volume of reserves in the NEM could be decreasing.
Unbundling reserves from energy to separately value flexible, responsive resources, through one or more new markets is what lies at the heart of this reform. The AEMC is currently considering two rule change requests that propose two different reserve service options. The AEMC published a Directions paper on these two rule change requests in January 2021 with a draft determination planned for December 2021. Detailed modelling to investigate the operational impacts of increasing variability and forecast uncertainty in the NEM is being completed to better understand the need for an operating reserve in light of stakeholder feedback. …
The ESB recommends (chapter 2 – p20/54):
3. The ESB recommends Energy Ministers note that AEMC rule change requests are underway to progress the following immediate and initial reforms to support the availability, investment in and scheduling of the resources capable of delivering essential system services:
a) frequency control, including a new fast frequency response service and enduring primary frequency response arrangements
b) operating reserves services, to explicitly value reserve services separately to energy
c) unit commitment for security and system security mechanism. These are operational and short-term procurement mechanisms allowing AEMO to value, procure and schedule specific services and resources to help keep the system secure
d) enhanced system strength frameworks, to make it simpler, faster, and more predictable for new generation to connect to the grid and keep supply as secure as possible
4. The ESB recommends Energy Ministers instruct the ESB to monitor and provide advice about market conditions and the need for, longer term reforms for essential system services, including the need for further unbundling of essential system services, an integrated ahead market or development of inertia spot market.
(A1c) As we alluded to, in the Generator Report Card 2018.
In the broader scheme of things, the ESB’s Final Advice essentially speaks to ‘the schism’ we explored in the Generator Report Card 2018 (GRC2018) as emerging in the market – between:
1. ‘Anytime/Anywhere Energy’ and
2. a broad range of other services under the umbrella ‘Keeping the Lights on Services’ identified.
2a) These are currently not directly remunerated, and are being increasingly squeezed out of the market because of pre-existing incentives promoting ‘Anytime/Anywhere Energy’, but sadly neglecting ‘Keeping the Lights on Services’.
2b) We’ve written before about how the form of support for Wind and Solar developments seems to be Villain #7.
—
So the ESB’s thinking seems to be that:
1) We’ve unbalanced the supply-demand dynamic with outside-the-spot-market support for ‘Anytime/Anywhere Energy’,
2) So the solution is to rebalance the equation by also adding in more outside-the-spot-market incentives for ‘Keeping the Lights on Services’.
3) In other words, the schism is underway – so the solution to the schism is to double down on the ‘balkanisation’ of the energy market.
4) In this light:
4a) The quantum of installed capacity (which Chapter 3 in Part A seeks to address)
4b) and firmness of offered capacity (which Chapter 4 in Part A seeks to address)
… are two elements of these ‘Keeping the Lights on Services’. There are others also discussed in the ESB’s Final Advice.
(A2) About the new data sets
Both of the above initiatives recommended by the ESB speak to providing a financial incentive for greater visibility, and firmness of, capacity – in advance of when the dispatch interval(s) in which that capacity might be required.
Leaving aside the merits of whether such mechanisms are required (and whether the ESB’s straw design is the best manifestation of such an arrangement) at the root they speak to the type of data that is currently the domain of the AEMO’s forecasting processes … particularly MT PASA, ST PASA and P30 predispatch.
That brings me to the AEMC Rule Change passed on 20th February 2020 – in relation to two particular improvements that have been made with respect to the MT PASA process (extending the time horizon, and requiring the publication of granular unit data … at least for Scheduled units, with Villain #8b still persisting with Semi-Scheduled plant).
(A2a) Overview of MT PASA
The AEMO currently describes MT PASA here as:
MT PASA assesses the adequacy of expected electricity supply to meet demand across the two-year horizon through regular assessment of any projected failure to meet the reliability standard. This assists Registered Participants and other stakeholders making decisions about supply, demand and transmission network outages over that period.
Each week participants must submit forecasts of availability to AEMO for the next 36 months, commencing from the first Sunday after the latest MT PASA run. These forecasts form the basis of the MT PASA report that will be produced the following week.
For further information, an MT PASA Process Description is provided here.
(A2b) Specifics, in the Rules
The current version of the rules is v171, and they are accessible here. Clause 3.7.2 of the rules pertains to MT PASA, and includes the following:
(d) The following medium term PASA inputs must be submitted by each relevant Scheduled Generator or Market Participant in accordance with the timetable and must represent the Scheduled Generator’s or Market Participant’s current intentions and best estimates:
(1) PASA availability of each scheduled generating unit, scheduled load or scheduled network service for each day taking into account the ambient weather conditions forecast at the time of the 10% probability of exceedence peak load (in the manner described in the procedure prepared under paragraph (h)):
(i) for a 36 month period in respect of each scheduled generating unit; and
(ii) for a 24 month period in respect of each scheduled load or scheduled network service; and
(2) weekly energy constraints applying to each scheduled generating unit or scheduled load for a 24 month period.
Note
This paragraph is classified as a tier 1 civil penalty provision under the National Electricity (South Australia) Regulations. (See clause 6(1) and Schedule 1 of the National Electricity (South Australia) Regulations.)
In section 10 of the Rules (the Glossary), the term ‘PASA availability’ is described as follows:
The physical plant capability (taking ambient weather conditions into account in the manner described in the procedure prepared under clause 3.7.2(g)) of a scheduled generating unit, scheduled load or scheduled network service available in a particular period, including any physical plant capability that can be made available during that period, on 24 hours’ notice
I’ve highlighted two of the provisions important in terms of what the ‘availability’ data actually means…
(A2c) Following the ERM Rule Change
Following the ERM-sponsored rule change, generators are required to submit (via their bids) forecast availability for their units into the future, every day for the next 3 years.
In simple terms, a units PASA Availability should be equal to its Maximum Capacity for every day except in occasions:
1. Where the Participant knows the unit is currently scheduled to be fully unavailable:
1a) Because it is on an outage; or
1b) Perhaps for other reasons; or
2. Where the Participant knows that the unit will have reduced capability:
2a) Which might be for some technical reason inside the plant; or
2b) Perhaps for some condition related to the weather (e.g. high temperature limitations); or
2c) Perhaps for some other reasons (e.g. potentially some type of fuel supply constraint).
The other important part of the rule change is that this unit-level availability forecast data series is now being published by AEMO, several times a day over 6 days in every week (not on Sundays).
(B) The concept of ‘Forecast Convergence’
For over a decade, we have been exploring the concept of ‘Forecast Convergence’ – or, in other words, how ‘accurate’* was some forecast in providing an advanced view of what might happen.
* keeping in mind that ‘accurate’ is not the best term to use here, as forecasts are often intended to elicit a response (i.e. the forecast, if effective, might change the parameter being forecast in the first place).
(B1) In our software
As far back as 2006 (with v2 of deSide®) we were helping clients view ‘variance’ of predispatch price forecasts through our software. A different representation, which has persisted through to the (newly release for 5MS) deSide v6 has been the function we called ‘volatility’.
That underlying concept was flipped around and greatly expanded in the ‘Forecast Convergence’ widget in our ez2view software. Our clients have been gratefully appreciative of this functionality.
(B2) In WattClarity® articles
As far back as this article from July 2008, we were wondering why more attention was not focused on ascertaining how useful were the prior year demand forecasts published by the TNSPs in their Annual Planning Statement.
Especially since the addition to ‘Forecast Convergence’ into the ez2view software, we’ve found it useful to use snapshots from the software to illustrate:
1) On some occasions we remembered to tag articles with ‘Forecast Convergence’.
2) You might also like to try the magic of Google with this query to find other articles we have written with the help of ‘Forecast Convergence’ (not all of them tagged manually).
(B3) In the (upcoming) Generator Insights 2021
We’re not going to make our (initially envisaged) release date of sometime in Q3 2021 … there’s under 3 weeks to go, and we have much to finish!
In between other work projects we have been continuing to explore various lines of analysis – including the exploration that Linton highlighted on 21st June 2021 when he asked ‘Is the predictability of day-ahead demand improving?’.
We’re very much looking forward to having GenInsights21 released (surely in Q4 2021, we would hope!), including a more detailed exploration of these types of questions.
—
With that driver (coupled with questions that stem out of the reasoning behind the ESB’s final advice) we have taken the ‘Forecast Convergence’ concept and applied it differently to the MT PASA DUID Availability data set.
(C) Analysis
Tuesday 31st August 2021 happened to be the day on which AEMO released its ESOO for 2021.
We selected that day because the data for this day was being published as far back as 20th August 2020 (when the ERM-sponsored rule change came into effect)… though readers should note that, had we selected another day the results might look different.
(C1) What happened on Tuesday 31st August 2021
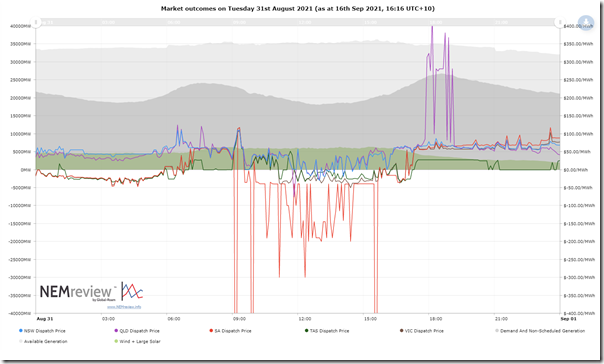
Opening up NEMreview v7, I quickly put this summary chart together to show high-level market outcomes on Tuesday 31st August 2021:
Those with licensed access can open their own copy of the query here.
We see in the chart that there was oodles of spare capacity during the middle of the day, and prices were low … very negative in South Australia). The supply-demand balance tightened in the evening with supply from Wind and Large Solar dropping off and demand climbing, as a result of which prices rose somewhat (and a modest spike in QLD).
However in summary note that the day was certainly not a stressful one in terms of tight supply/demand balance. Entirely understandable on the supply side if some units did not stretch to make themselves available.
(C2) Winding backwards, to look forwards to 31st August 2021
Winding the clock back to start at 20th August 2020 and then walking forwards on a daily basis (albeit without Sundays, as no MT PASA DUID Availability data is published on a Sunday) we wondered what had been forecast, in terms of aggregate PASA Availability looking forward to 31st August 2021:
1. How did this change on a day-by-day basis; and
2. How different were these projections from what actually happened.
(C2a) NEM-wide
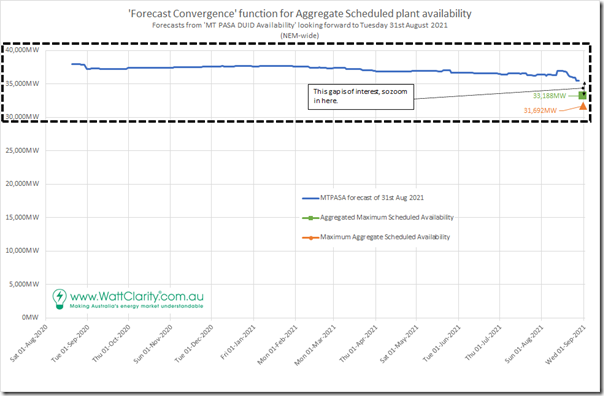
Let’s have a look on a NEM-wide basis, for a start – with a different type of ‘Forecast Convergence’ view:
This view steps through (in the blue line) successive MT PASA projections for 31st August by publication date. In this case we thought it simplest to start by looking at a NEM-wide aggregate:
1. Across all regions; and also
2. Across all fuel types …
3. Remembering that Semi-Scheduled and Non-Scheduled plant are not included in this aggregate (i.e. Scheduled supply-side units only).
The dotted area is the one of particular interest, so we zoom in:
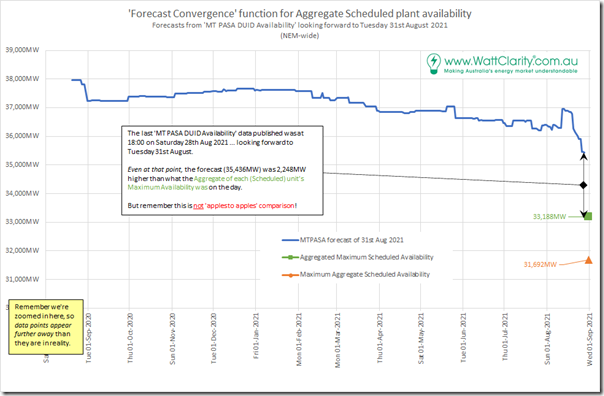
Co-opting that warning that ‘variations and movements shown here are smaller than they initially might seem in this relative scale’ we see that:
1. the overall trend of aggregate availability over the ~376 day time range was for it to trend downwards; and
2. there is a sizeable gap between the final aggregate MT PASA DUID Availability data point (published for 18:00 on Saturday 28th August 2021) and the Aggregate of each Scheduled (supply) units maximum dispatch Availability that was actually seen by AEMO (i.e. through each units bids) on Tuesday 31st August 2021.
3. As noted on the image, the gap equates to 2,248MW
4. However remember that this is not an ‘apples to apples’ comparison … as:
4a) the PASA Availability figure is the capacity that could be delivered at 24 hours notice, and
4b) the green dot shows the sum of each unit’s maximum bid availability through 31st August 2021 (i.e. understanding that these maximums won’t all be coincident in the same dispatch interval of the day).
5. In addition to that gap, it’s also interesting to note that there was a noticeable (in relative terms) drop in aggregate MT PASA DUID Availability in the final week or so leading up to the end of that data run.
5a) Perhaps we can assume that this was (at least to some part) due to forecasts of plentiful surplus capacity some participants have decided it was not worth their while to make preparations (such as securing gas delivery capacity for that day).
5b) We’ve not invested time to drill into the detail (e.g. for particular units, or types of units).
(C2b) QLD Region
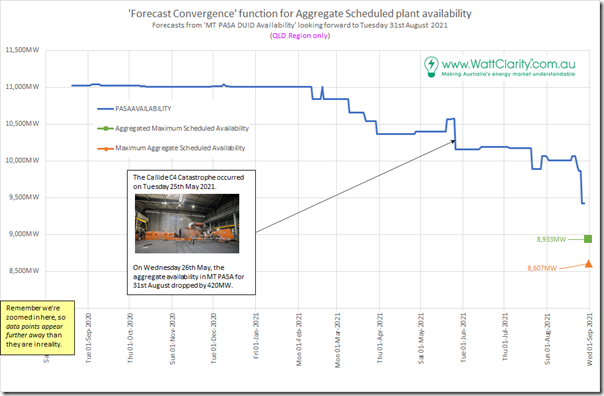
It’s logical to want to slice the data up in a number of ways – we’ve chosen to look on a regional basis, starting with the QLD region:
Remember that this chart, and others below, are all ‘zoomed in’.
The immediate aftermath of the Callide C4 Catastrophe can be clearly seen on Tuesday 25th May 2021, with aggregate availability dropping 420MW. The size of the drop closer to 31st August is larger, though.
(C2c) NSW Region
It’s logical to want to slice the data up in a number of ways – we’ve chosen to look on a regional basis, starting with the QLD region:
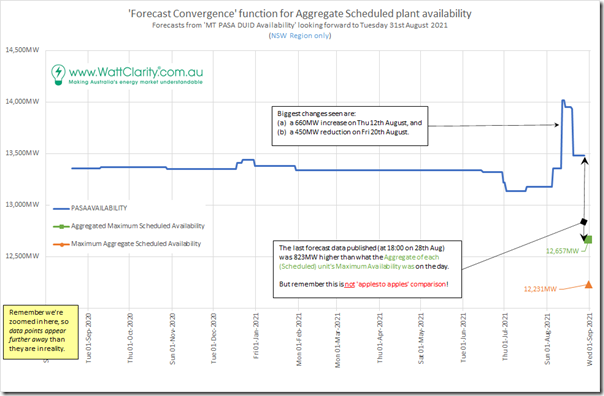
In the case of the NSW region, the standout variation is the one that occurs much closer to the point of dispatch:
(i) Increase by 660MW on 12th August
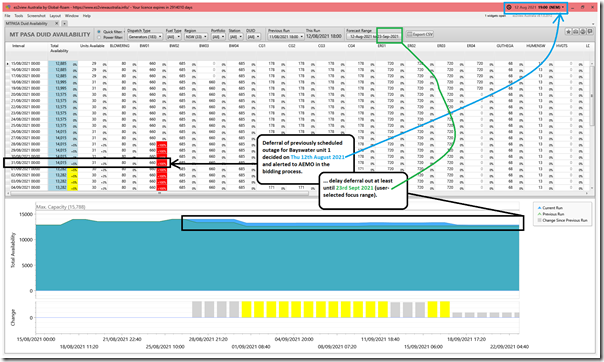
As shown in this snapshot from the ez2view v9.1.0.2012 ‘MT PASA DUID Availability’ widget, time-travelled back to 19:00 on Thursday 12th August, we see that this increase is because of a delay in a scheduled outage for Bayswater unit 1 unit that was only determined and alerted to AEMO on 12th August:
This delay/deferral pushes the start date of the outage at least part 23rd September, which is what I’d selected as the forecast time range (from 18th Sept 2021 there was also a new scheduled outage for Liddell unit 4 planned).
(ii) Reduction by 450MW on 20th August 2021.
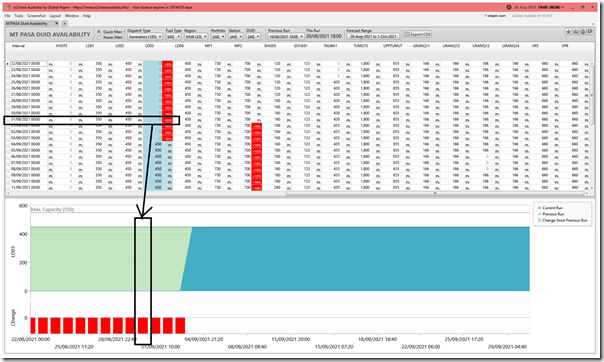
Time-travelling the same widget forward to 19:00 on Friday 20th August 2021 enables us to see the cause of this 450MW reduction compared to the last run of the prior day:
In this case, the Liddell unit 3 has been (newly) forecast to come off from that Sunday 22nd August.
—
Both of these changes illustrate the high degree of potential variability in the day-to-day trend above (i.e. aggregated across 183 Scheduled supply-side units in NSW). They also pose food for thought in terms of how such a ‘capacity market’, and an ‘ahead market’ would actually work.
(C2d) VIC Region
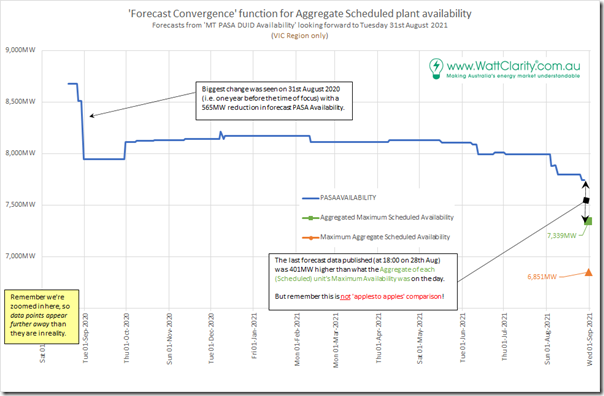
Here’s the Victorian region:
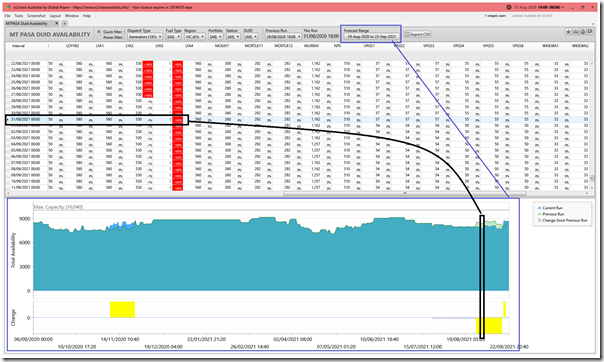
I’ve highlighted the big change in the forecast seen a year in advance of actual.
Here’s the same widget in ez2view, time-travelled back to 31st August 2020 at 19:00 and with the ‘Forecast Range’ set to span over a year, out till 23rd September 2021:
We can see here that the movement shown there (i.e. 565MW reduction) was for a change in the outage planned a year earlier for Loy Yang A3.
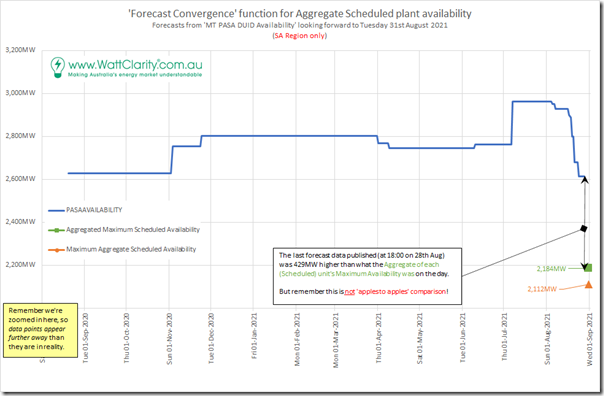
(C2e) SA Region
Here’s the South Australian region:
This line trends up, before dropping back just prior to dispatch.
I’ve not invested time to understand the specifics of why – it’s more important for readers to understand that these outage schedules are frequently moving around (that’s part of the purpose of the MT PASA process!).
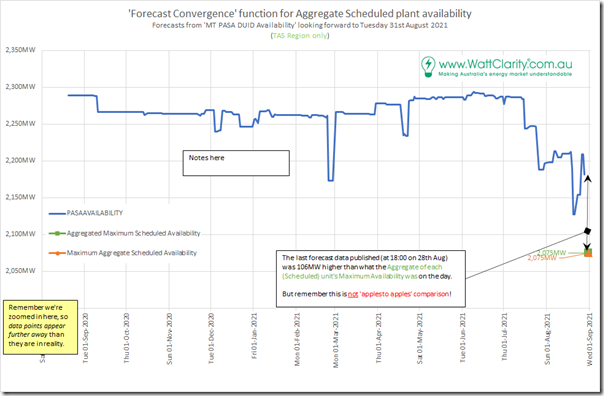
(C2f) TAS Region
Here’s the Tasmanian region:
A predominantly hydro region, we see that there are also plenty of changes of outage schedules in the months (weeks and days) ahead of 31st August 2021.
(D) Implications, or Questions?
This brief analysis is presented as a conversation starter – as we are currently pondering what the future might look like:
1) in terms of the underlying physical plant mix,
2) but also what the market arrangements might look like if the ESB’s Final Advice is adopted in some form,
3) and finally what this would mean to the data being published to the market more broadly.
Time permitting, we’ll detail more of what we have determined in the upcoming GenInsights2021 publication.
We’d welcome your engagement prior to that time!


Why does MT PASA only appear to apply to generation plant and not to transmission? Many of the times of high prices are because of interstate transmission outages, much of which is planned months ahead but doesn’t seem to be visible to market partipants. There are also intrastate transmission limitations that restrict how some dispatchable plant can bid or contribute to a capacity market. Until Humelink is built there are limitations on how Lower Tumut (1800 MW), Uranquinty (664 MW) and the Maoneng battery (200 MW) can access the Sydney market. How would a capacity market allocate the limited transmission capacity to each of these generators?
The Network Outage Schedule is available on the AEMO website covering a period of 13 months in advance. Search on the AEMO website for “Network Outage Schedule” and “Planned Electricity Network Outages”. The MT (and ST) PASA processes use a model of the entire NEM including generation, demand and transmission. AEMO uses information from the Network Outage Schedule as an input to the PASA process.