
A threshold for accuracy and threshold for bias has been set to evaluate whether a load’s baseline methodology is acceptable for the Wholesale Demand Response mechanism.
Just prior to the publication of the Wholesale Demand Response Guidelines (final) the draft report and determination on the Baseline Eligibility Compliance and Metrics Policy, and its accompanying draft policy, was published (March, 2021).
The policy:
- Establishes how AEMO will determine baseline eligibility and compliance under the WDRM; and
- Sets out an error and a bias metric with threshold values for application to eligibility and compliance evaluation.
Given the threshold values in the draft policy, we’ve tested some example load profiles against resultant baselines to get a feel for how stringent or relaxed the thresholds are.
What is a 10 out of 10 baseline?
Relating to demand response events, the baseline is the load that would have occurred if a demand response event had not been triggered. It’s most accurate, therefore, when the load profile is predictable.
Initially, when the WDR mechanism goes live, there will be four baseline methodologies available for adoption based on the X of Y approach. This approach denotes that X days of load (or consumption) data from the most recent Y days will be used to construct the baseline. At commencement of the WDR mechanism a “10 of 10” approach will be used:
- 10 out of the most recent 10 eligible days of historical load data will be used to estimate the baseline.
- This mirrors the California Independent System Operator’s “Standard Baseline” methodology and therefore is sometimes referred to as the CAISO 10 of 10 method.
The four methodologies proposed for the start of the WDR mechanism are differentiated by which days are applicable:
- Business days,
- Non-business days,
- All days,
- A composite of business and non-business days.
Once the days are determined, the baseline is formed by summarising the load data into one value per period:
- The simplest approach, which is initially proposed for the WDR, is to take the average per interval.
The baseline will be applied to settle WDR Unit activity after WDR events have taken place. It is designed to limit potential over or under payment of WDR and does not play a role in operational activities.
Further information on baselines (including other methodologies and reviews) can be uncovered in these reports:
- DNV KEMA’s 2013 report on baseline consumption methodologies
- The ARENA and Oakley Greenwood 2019 report on Baselining the ARENA-AEMO Demand Response RERT Trial
- Nexant’s 2017 California ISO Baseline Accuracy Assessment
The thresholds for eligibility and compliance
The thresholds are the key parameters that need to be met for a load’s baseline to be acceptable.
The draft policy defines a relative root mean square error (RRMSE) threshold of 20% and an average relative error (‘ARE’, bias) threshold of ±4%.
The baselines will be evaluated on data within eligibility and compliance windows, proposed to be between 3pm and 8pm market time – a narrow window aimed to cover periods when high price periods typically occur in the NEM and thereby allow a greater range of loads to be eligible.
AEMO notes that the start of the mechanism coincides with the transition from 30-minute to 5-minute trading intervals so historical load data (before October 1, 2021) will be on a 30-minute basis. The reduced variability in the 30-minute data may well make it easier for the baseline to meet the required thresholds.
So, do the thresholds still accommodate much load variability?
In its draft determination on the policy AEMO noted that 6 submissions included remarks on the accuracy threshold of 20% and that half of them expressed agreement with the threshold.
I decided to put both thresholds into context so I could get a preliminary feel for how much variability these thresholds tolerate.
To do this I’ve have simulated four loads to test and elucidate what shapes and profiles might breach these thresholds.
- I used 10 days of data at 5-minute resolution to calculate one baseline for each load type. Keen eyes here will notice that the baseline is at 5-minute granularity to align with 5-minute meter data. Initially, until 5-minute trading interval data becomes available, the meter data used to derive real baselines will be at 30-minute resolution.
- The baseline methodology takes the average consumption (I’ve used load for this exercise), per trading interval, over the 10 days.
- I have evaluated the baselines using the same 10 days but reduced the charts (below) to Day 1 and Day 10, to inspect and distinguish the resulting accuracy and bias more easily. In practice more days (20 – 50) would be assessed.
- The evaluation utilises adjusted baselines – that is, it uses multiplicative adjustment capped at 20% to adjust the baseline up or down. The adjustment factor is derived from average load relative to the average baseline in the three-hour window that ends one hour before the evaluation period. This leaves a ‘pre-event hour’ which does not play a role in baseline evaluation.
- The evaluation period is set to be 5 hours which is the duration of the evaluation window proposed in the draft policy.
For convenience, the loads are labelled “Steady”, “Smooth”, “Blocky” and “Variable”.
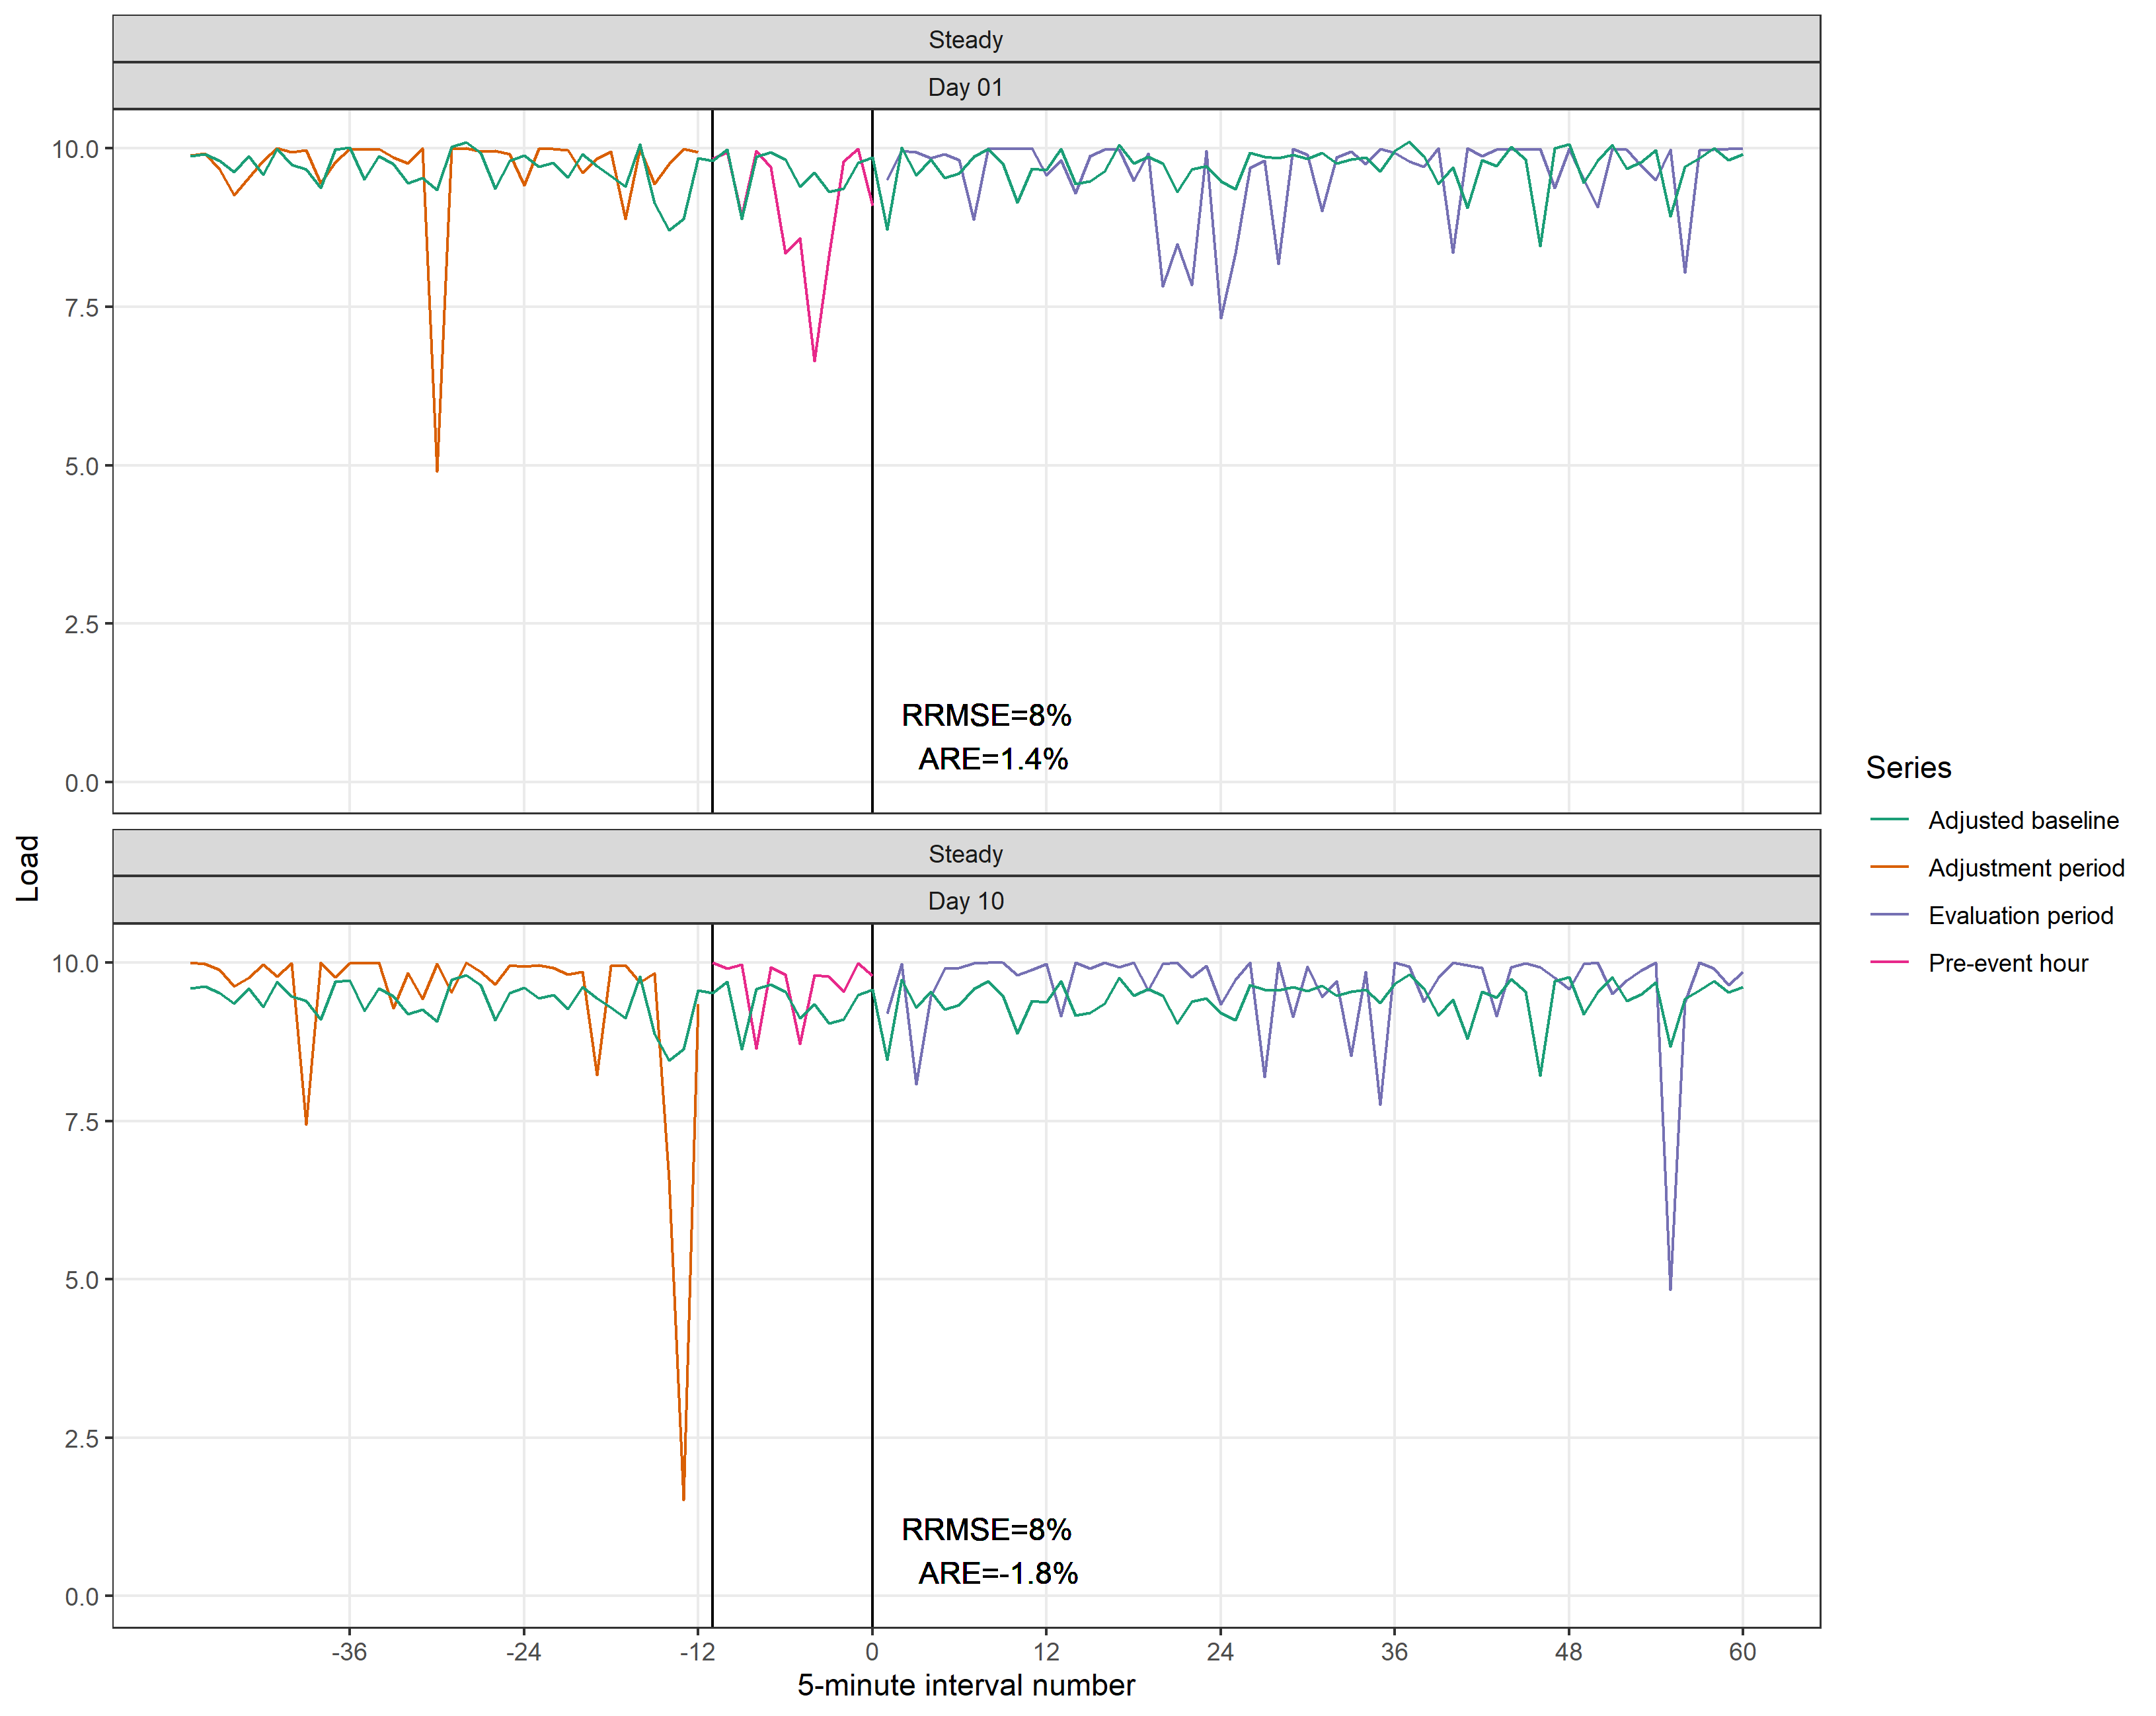
Load Profile #1 Steady
The Steady load, although exhibiting some temporary dips in demand, still clearly meets the accuracy and bias thresholds.
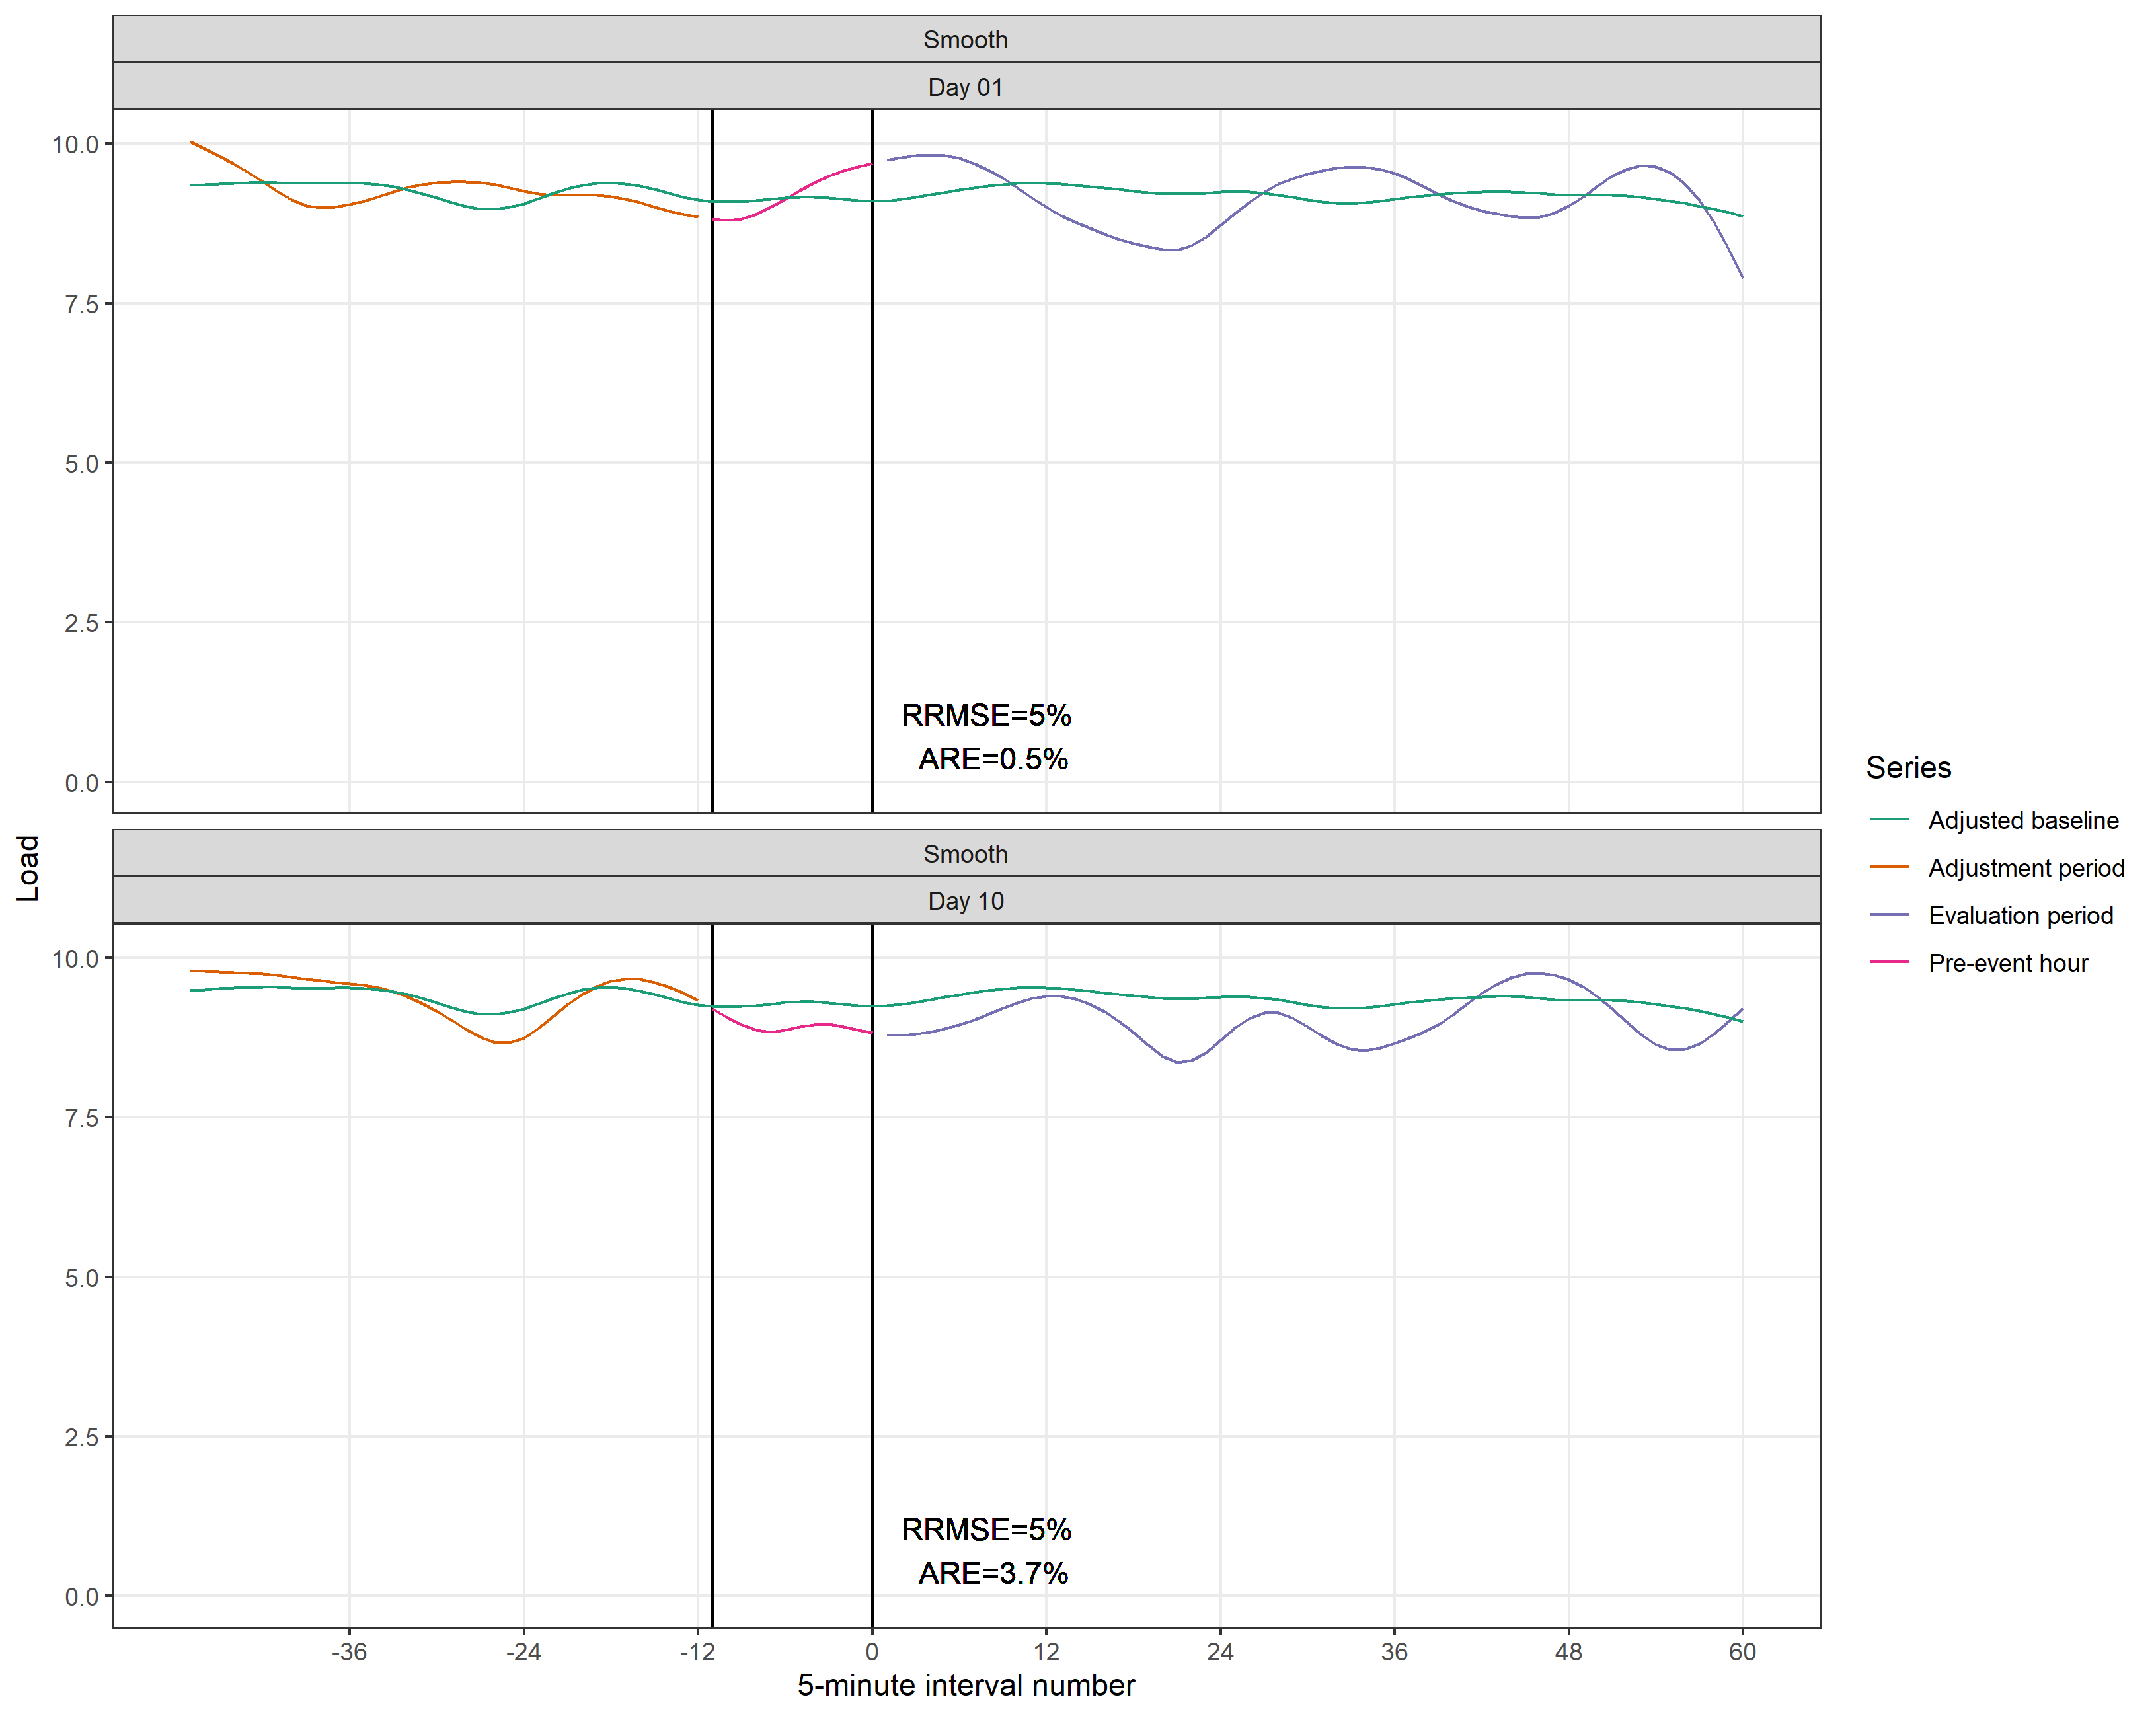
Load Profile #2 Smooth
The Smooth load, although less visually variable than the Steady load, has a relatively high bias on Day 10. This is caused by a drop in demand over the pre-event hour leading to a departure from the adjusted baseline level. Nevertheless, the ARE is 3.7%, within the 4% threshold.
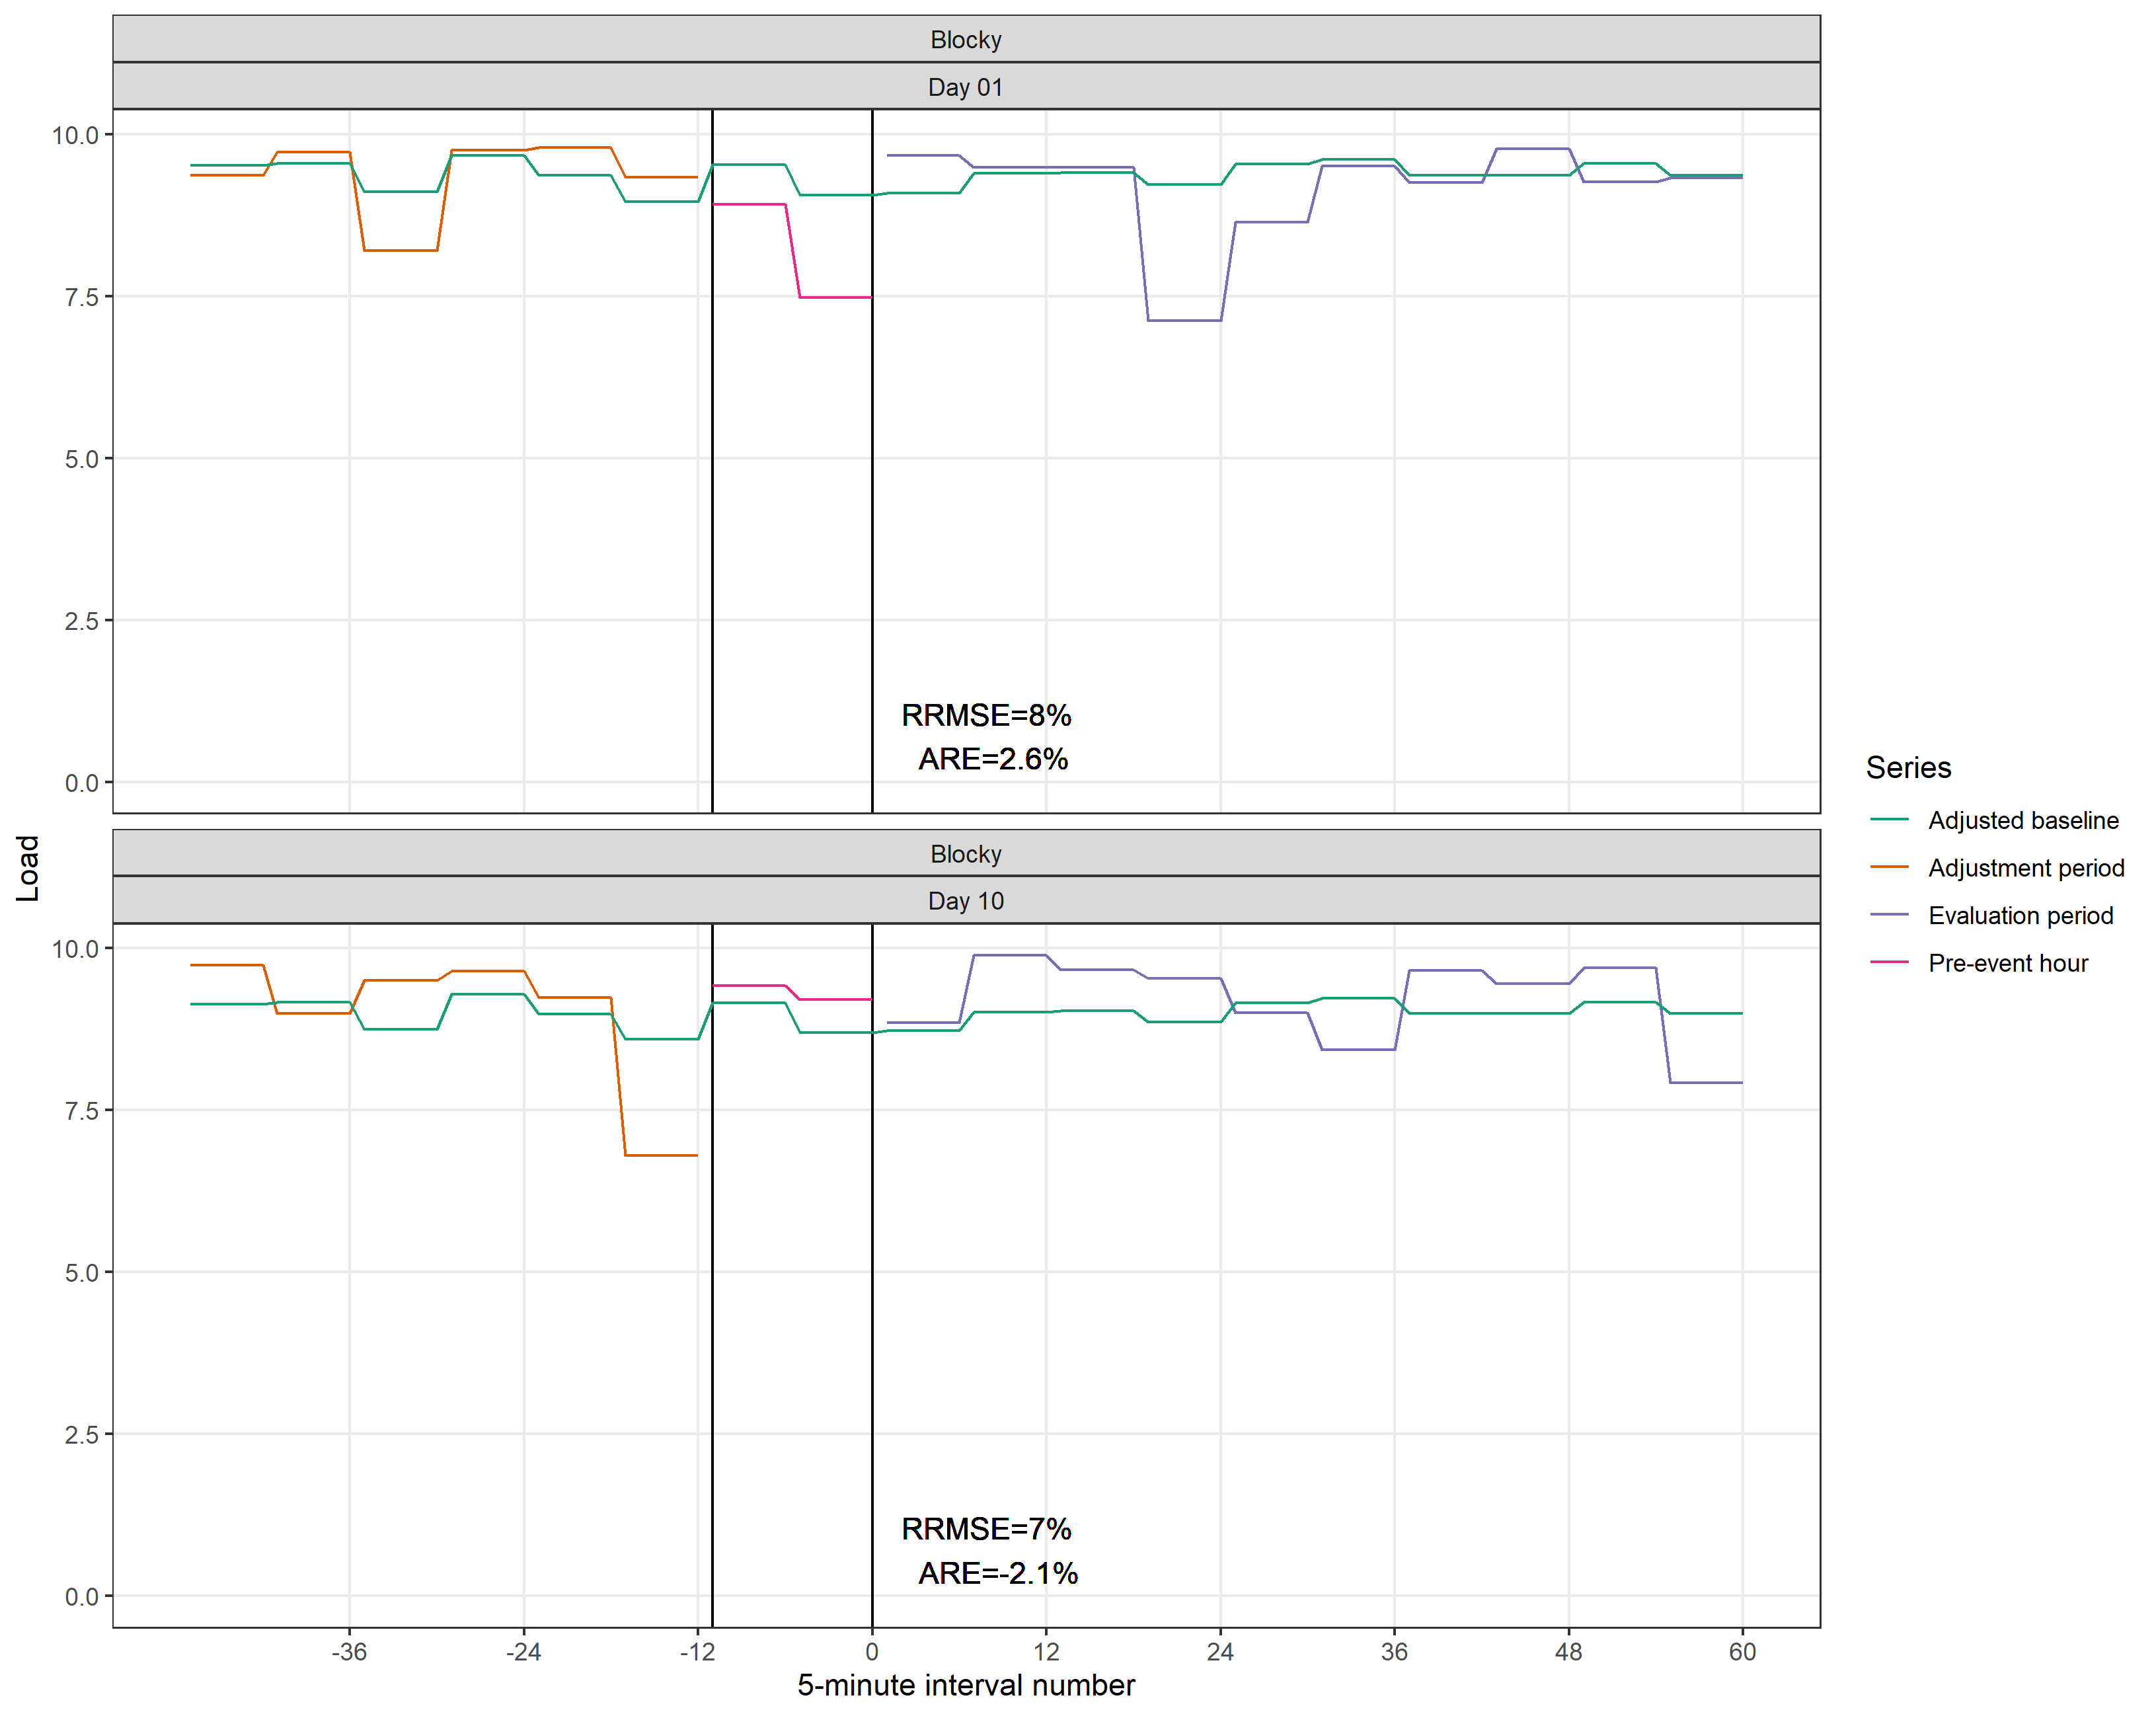
Load Profile #3 Blocky
The blocky load exhibits change at a 30-minute granularity. Although demand drops in some periods by more than 20%, the relative RMSE is still well within the 20% threshold overall.
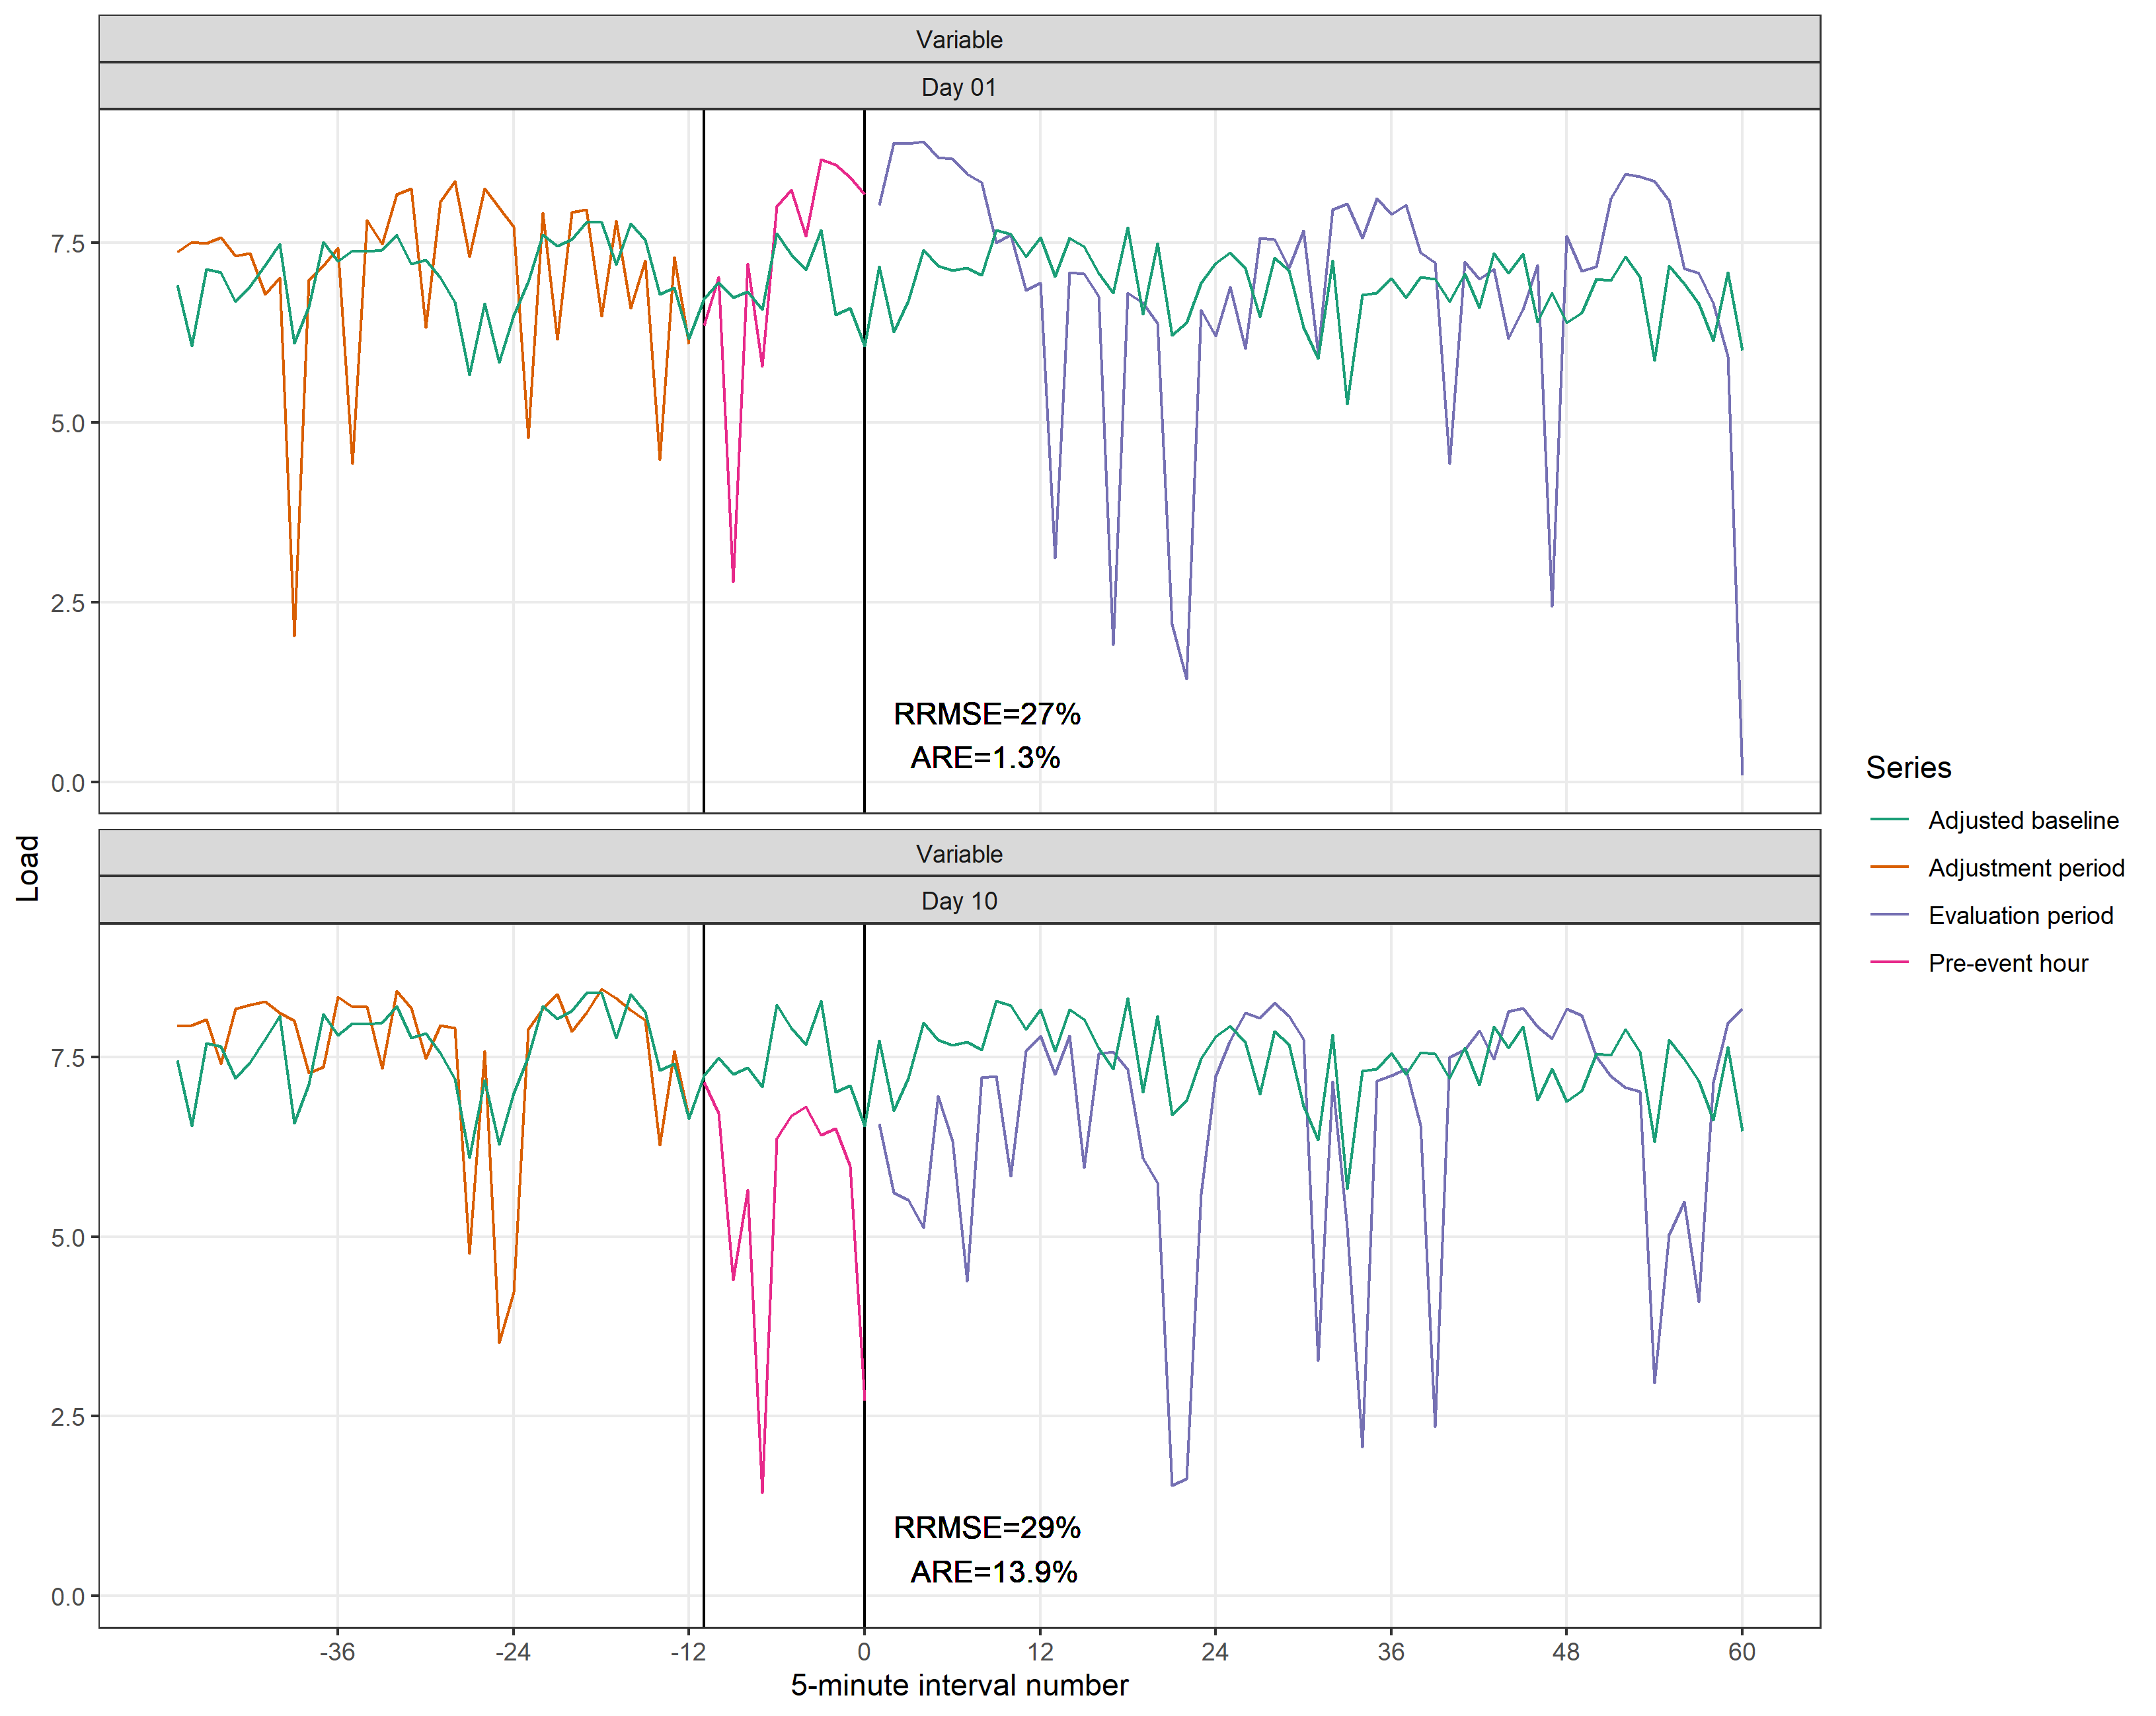
Load Profile #4 Variable
The Variable load was given the greatest level of random variability and has less of a typical and predictable demand level. The accuracy and bias scores both exceed the thresholds on the Day 10 profile. Although the variability was high on Day 1 the bias threshold was not exceeded as positive and negative baseline differences generally cancelled each other out.
From this quick and hypothetical assessment two things stand out:
- The load levels during the adjustment period can impact results.
The load should be steady and consistent throughout the adjustment period and into the event period. If the load in these two periods happens to be out of sync, the baseline adjustment process will likely set a baseline that does not align with the actual load, leading to higher bias levels. - The RRMSE threshold of 20% appears to permit a reasonable degree of variability when it is relatively random and underpinned by a consistent load level.
What the AEMO approach does not do is allow end users that have a weather driven demand (eg shopping centres) to provide WDR. These sites are ideally suited to provide WDR when it is most needed, but are excluded from providing WDR
Absolutely agree, David. The 20 per cent cap on adjustments will prevent many temperature sensitive loads from participating, which is unfortunate because these are exactly the kinds of loads you want to be offering WDR when it’s hot and supply/demand is tight. AEMO seems resigned to its current approach for market start, but I’m hopeful they will open the market to a wider range of load types soon after.