Summer 2020-21 was far less eventful than prior summers – though not totally quiet. For instance, Sunday 24th January 2021 was an interesting day because of a couple discrete incidents – including two that were of particular interest to me:
Incident #1) There was a price spike in the the 16:35 (to $2,173.06/MWh) and 16:40 (to $15,000/MWh) dispatch price for the QLD region.
1a) It wasn’t the only price spike in QLD in recent times … but it was one of particular interest
1b) As noted here in the first article for the day, we determined that the ‘Q>>NIL_CLWU_RGLC’ constraint equation rapidly reduced the output of many generators in QLD of varied fuel types. The resultant drop in supply meant that prices could only go one way – up, and quickly!
1c) What made this even more interesting was that this happened through the period where the AEMO experienced a total SCADA Failure, which will have impacted on their operations in various ways.
Incident #2) Later the same day, there were also stresses in the SA region, as discussed in this 2nd article for the day…. however that’s not the subject of this particular article.
On 15th February 2021 the AEMO published a ‘Preliminary Report – Total loss of SCADA systems on 24th January 2021’, in which they communicated a number of things – including that the SCADA outage lasted from 15:46 through until 16:56 (both NEM Time). With use of that AEMO Preliminary Report, I’ve attempted to advance our analysis to the point where I can post this article as a sort of ‘Part 3’ in a sporadic investigation into what happened
WARNING: There may well be errors in the analysis behind this article, given the complexities involved (including the difficulty for me in ascertaining whether InitialMW numbers are actually metered or just assumed at various points through the sequence of events). If you do find errors, it would be great if you could let us all know in comments below the article!
(A) Why do we invest in completing investigations like these?
There are a number of reasons why we engage in forensic analysis like this particular one – including these two big reasons. This event, in particular, has already revealed a couple of things we can do in our ez2view software to continue to enhance its capability – which we’ll look forward to delivering as part of the move towards version 9.1 and then into the future…
Of course, if you could help us in these ways (or know of people who can help us) please let us know?
(B) High-level sequence of events (a current understanding)
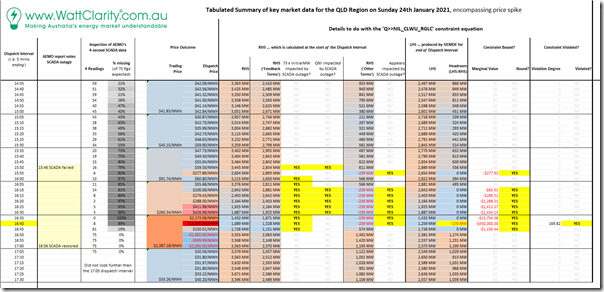
In the following table I have presented our current understanding of a high-level sequence of results for a couple of hours spanning the price spike and disruption to SCADA feed:
Click on the image (or here) for a larger – and more readable – view of this table.
As we continue through the article, I will be seeking to explain some of what is noted in this table. With respect to the two columns based on the 4-second SCADA data, refer to this prior (i.e. ‘Part 2’) article to see graphically how the SCADA:
(1) Did not disappear completely;
(2) And indeed seems to have had problems for a longer time range than the AEMO indicated in their Preliminary Report .
… this is just one of a number of (confusing) factors that has made it difficult to try to understand what actually happened on this afternoon.
In this article we outline our current understanding in the hope that the more learned readers can help us understand things we might be missing (or errors we have made).
(C) About the ‘Q>>NIL_CLWU_RGLC’ constraint equation
In the table above we see that it was the 16:40 dispatch interval that saw the dispatch price spike (to $15,000/MWh, the current Market Price Cap).
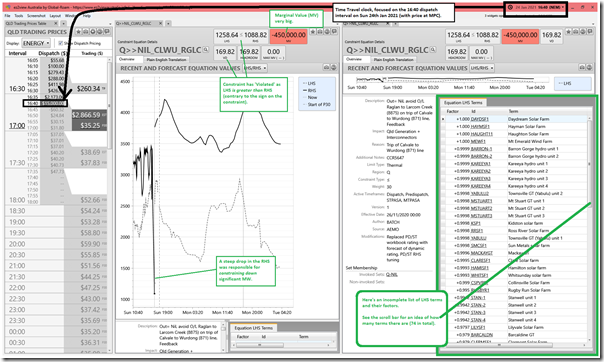
It also saw the ‘Q>>NIL_CLWU_RGLC’ constraint equation violate, with a negative headroom (-170MW) because the LHS ended up greater than the RHS. Much of this article pertains to what happened to this constraint equation, as it was the one that ‘caused’ the price spike – hence let’s start by viewing some aspects of this constraint equation in the 16:40 dispatch interval using the very useful ‘Time-Travel’ function and a combination of Widgets in our ez2view software:
(C1) A quick reminder about the form of constraint equations
As noted on the Glossary Page, on most occasions (with FCAS constraints being a notable exception, but not the only one) the form of the constraint is as follows:
LHS ≤ RHS
This is the case for most constraint equations (with a notable exception being FCAS constraints, along with several others).
—
This particular constraint equation is for the purpose of ‘avoiding overload of the Raglan to Larcom Creek (8875) on trip of Calvale to Wurdong (871) line’ (these lines are all in Central Queensland). It’s a member of a ‘System Normal’ constraint set, so always invoked.
(C2) The LHS of the ‘Q>>NIL_CLWU_RGLC’ constraint equation
Because NEMDE is a linear program (LP), the Left-Hand-Side (i.e. LHS) must be a linear expression. This means that it must be of the following form:
LHS = Factor1 x Var1 + Factor2 x Var2 + … FactorN x VarN
… and the Var1, Var2 … VarN are DUIDs and interconnector elements that NEMDE gives Dispatch Targets to.
The LHS is determined in the NEMDE run, and applies to the end of the dispatch interval. In other words, the Dispatch Targets are given to the DUIDs (i.e. Var1, Var2 … VarN) and interconnector elements to indicate where they are expected to be at the end of the dispatch interval.
—
For the 16:40 dispatch interval we have highlighted some of the relevant information in the 3-widget display here:
We can see the start of the LHS terms and factors in the window above. In the interests of completeness, here is the full list:
0.979 x Barcaldine GT (ENERGY)
+ 0.9998 x Townsville GT (Yabulu) unit 1 (ENERGY)
+ 0.9998 x Sun Metals solar farm (ENERGY)
+ 1 x Mt Emerald Wind Farm (ENERGY)
+ 0.1135 x Millmerran unit 1 (ENERGY)
+ 0.1135 x Millmerran unit 2 (ENERGY)
+ 0.9797 x Lilyvale Solar Farm (ENERGY)
+ 0.9999 x Barron Gorge hydro unit 1 (ENERGY)
+ 0.9999 x Barron Gorge hydro unit 2 (ENERGY)
+ 0.1385 x Braemar 1 GT unit 1 (ENERGY)
+ 0.1385 x Braemar 1 GT unit 2 (ENERGY)
+ 0.1385 x Braemar 1 GT unit 3 (ENERGY)
+ 0.1404 x Kogan Creek (ENERGY)
+ 0.1385 x Braemar 2 GT unit 5 (ENERGY)
+ 0.1385 x Braemar 2 GT unit 6 (ENERGY)
+ 0.1385 x Braemar 2 GT unit 7 (ENERGY)
+ 0.1377 x Darling Downs GT (ENERGY)
+ 0.1377 x Darling Downs solar farm (ENERGY)
+ 0.8309 x Callide B unit 1 (ENERGY)
+ 0.8309 x Callide B unit 2 (ENERGY)
+ 0.8309 x Callide C unit 3 (ENERGY)
+ 0.8309 x Callide C unit 4 (ENERGY)
+ 1 x Daydream Solar Farm (ENERGY)
+ 1 x Hayman Solar Farm (ENERGY)
+ 0.9995 x Clare Solar farm (ENERGY)
+ 0.1396 x Condamine CCGT (ENERGY)
+ 0.999 x Collinsville Solar Farm (ENERGY)
+ 0.1499 x Coopers Gap Wind Farm (ENERGY)
+ 0.9998 x Townsville GT (Yabulu) unit 2 (ENERGY)
+ 1 x Haughton Solar Farm (ENERGY)
+ 0.9999 x Kareeya hydro unit 1 (ENERGY)
+ 0.9999 x Kareeya hydro unit 2 (ENERGY)
+ 0.9999 x Kareeya hydro unit 3 (ENERGY)
+ 0.9999 x Kareeya hydro unit 4 (ENERGY)
+ 0.9702 x Emerald Solar Farm (ENERGY)
+ 0.9781 x Middlemount Solar farm (ENERGY)
+ 0.979 x Clermont Solar Farm (ENERGY)
+ 0.9996 x Mackay GT (ENERGY)
+ 0.995 x Rugby Run Solar Farm (ENERGY)
+ 0.09239 x Yarranlea Solar Farm (ENERGY)
+ 0.09239 x Maryrorough Solar Farm (ENERGY)
+ 0.09235 x Warwick Solar Farm 1 (ENERGY)
+ 0.09235 x Warwick Solar Farm 2 (ENERGY)
+ 0.9998 x Mt Stuart GT unit 1 (ENERGY)
+ 0.9998 x Mt Stuart GT unit 2 (ENERGY)
+ 0.9998 x Mt Stuart GT unit 3 (ENERGY)
+ 0.09239 x Oakey GT unit 1 (ENERGY)
+ 0.09239 x Oakey GT unit 2 (ENERGY)
+ 0.1396 x Roma GT unit 7 (ENERGY)
+ 0.1396 x Roma GT unit 8 (ENERGY)
+ 0.9998 x Kidston solar farm (ENERGY)
+ 0.9998 x Ross River Solar Farm (ENERGY)
+ 0.9993 x Hamilton solar farm (ENERGY)
+ 0.9993 x Whitsunday solar farm (ENERGY)
+ 0.9942 x Stanwell unit 1 (ENERGY)
+ 0.9942 x Stanwell unit 2 (ENERGY)
+ 0.9942 x Stanwell unit 3 (ENERGY)
+ 0.9942 x Stanwell unit 4 (ENERGY)
+ 0.09239 x Oakey 1 Solar Farm (ENERGY)
+ 0.09239 x Oakey 2 Solar Farm (ENERGY)
+ 0.1334 x Tarong North (ENERGY)
+ 0.1334 x Tarong unit 1 (ENERGY)
+ 0.1334 x Tarong unit 2 (ENERGY)
+ 0.1334 x Tarong unit 3 (ENERGY)
+ 0.1334 x Tarong unit 4 (ENERGY)
+ 0.1401 x Gangarri Solar Farm (ENERGY)
+ 0.1205 x MW flow north on the QNI AC Interconnector
-0.4937 x Childers Solar Farm (ENERGY)
-0.4722 x Susan River Solar Farm (ENERGY)
-0.8142 x Gladstone unit 1 (ENERGY)
-0.8142 x Gladstone unit 2 (ENERGY)
-0.8048 x Gladstone unit 3 (ENERGY)
-0.8048 x Gladstone unit 4 (ENERGY)
-0.8142 x Gladstone unit 5 (ENERGY)
-0.8142 x Gladstone unit 6 (ENERGY)
In particular note that:
1) most DUIDs (65 of 73) are associated by positive factors
(a) these are the ones that will be ‘constrained down’ when the constraint binds
(b) also important to note that some factors (e.g. for MEWF1, at 1.0) are ~10 times as large as for other DUIDs (e.g. 0.09239 for OAKEY1SF) – this impacts on which units are ‘constrained down’ first (assuming their bids are equal).
2) the dispatch target of QNI is also included … with a positive factor (i.e. the constraint will try to reduce flow northwards, or increase flow south).
3) there are 8 DUIDs with negative factors – which are the ones that this constraint will try to ‘constrain up’.
(a) These 8 x DUIDs are all south of the Raglan to Larcom Creek (8875) Line on the coastal route into Brisbane.
(b) It’s easy to see this collection in the ‘QLD Schematic’ within ez2view, as shown in the example further below.
(C3) The RHS of the ‘Q>>NIL_CLWU_RGLC’ constraint equation
The Right-Hand Side (RHS) reflects the things that generally NEMDE can’t control, but essentially treats as “Constant” for the given dispatch interval. The RHS is calculated at the start of the dispatch interval using meter readings of certain parameters taken at the start of the dispatch interval.
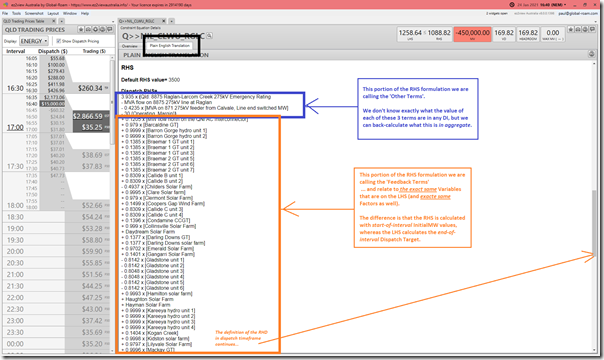
Flipping to the ‘Plain English Translation’ tab in the ez2view widget above we see the form of the RHS used in the dispatch time horizon (it’s a little different for P5 predispatch and P30 predispatch):
As annotated on the image, we can look at this RHS formulation as two groups of terms:
1) Group 1 are the ‘Feedback Terms’ which are the exact same (74 in total) terms and factors shown above for the LHS … with the difference being that (in the RHS) the metered InitialMW values are used for start of interval values.
2) Group 2 are the ‘Other Terms’ which are four terms in total, three of which (i.e. 2 x flows and 1 x dynamic line rating) are dynamically updated by Powerlink and supplied to AEMO using the interconnected SCADA system … with the 4th term being the constant (30).
For completeness, the ‘Other Terms’ are constituted as:
3.935 x (Qld: 8875 Raglan-Larcom Creek 275kV Emergency Rating
– MVA flow on 8875 275kV line at Raglan
– 0.4235 x [MVA on 871 275kV feeder from Calvale, Line end switched MW]
– 30 {Operating_Margin})
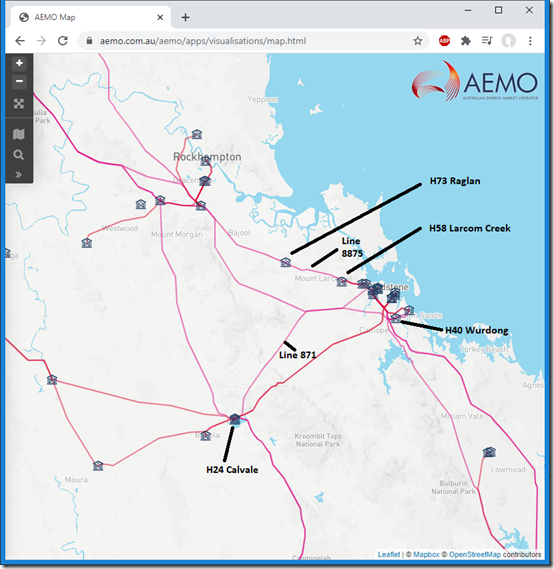
Annotating the AEMO Map, here’s some quick locations in central Queensland referenced in the RHS:
(D) Dispatch Intervals in sequence
With the above as background (and also keeping in mind we will look to drill in further in a Part 4 to the Case Study – time permitting), let’s start at the 15:45 dispatch interval and walk through the key dispatch intervals in some detail (considerable detail for the first few), to explore what (we currently believe) happened:
(D1) The 15:45 dispatch interval
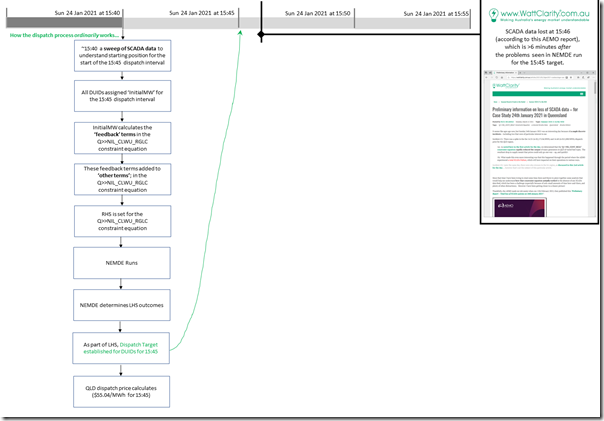
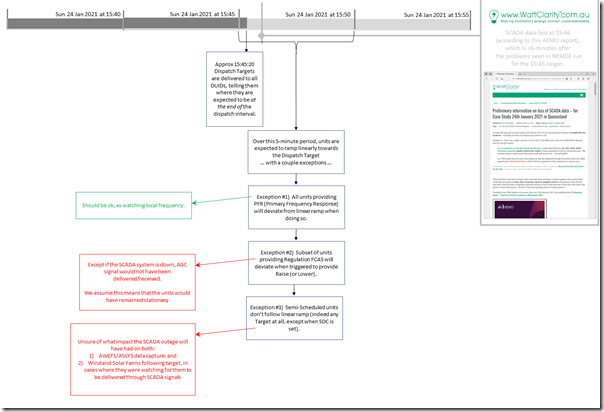
This dispatch interval starts at 15:40 (or shortly beforehand) as the AEMO conducts a sweep of available SCADA data in order to ascertain the starting position of the DUIDs and network elements that it monitors. The starting position is recorded as ‘InitialMW’ for each DUID for the 15:45 dispatch interval:
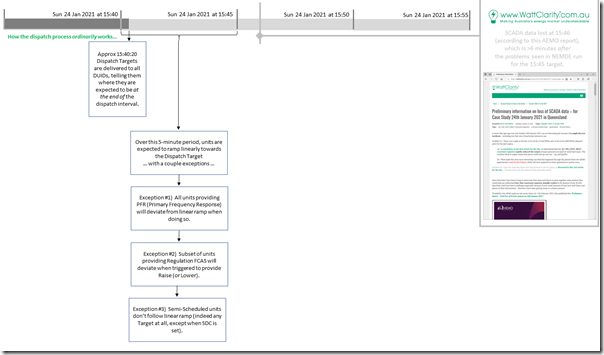
These ‘start of interval’ values are then processed through the RHS, then (via NEMDE) to the LHS in order to establish Dispatch Targets for all 73 x DUIDs (plus QNI) for where they are expected to be at the 15:45, as shown above. The DUIDs strive to deliver their targets as indicated below:
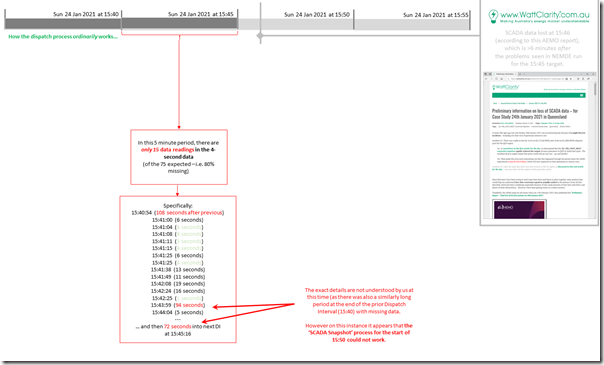
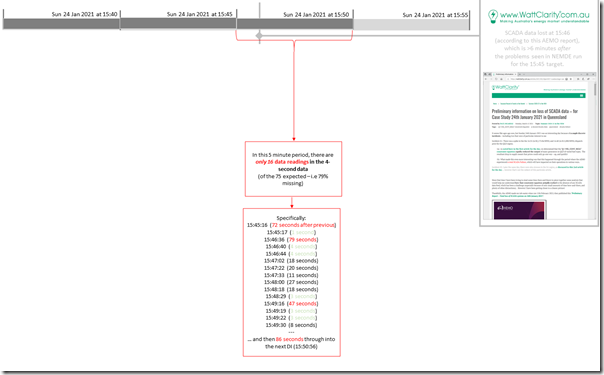
… however as illustrated below, the AEMO’s 4-second SCADA data (used for determining cost allocation for Regulation FCAS using a ‘Causer Pays’ approach) contains a number of holes during this 15:45 dispatch interval:
Refer to the table at the top of this article to see that there were 80% of the expected data updates were missing in this 5-minute period (i.e. only 15 arrived). It appears* that this had some effect on the outcome for the next dispatch interval, as illustrated next…
* Very happy for those who are more knowledgeable than us to point out any error in this understanding!
(D2) The 15:50 dispatch interval
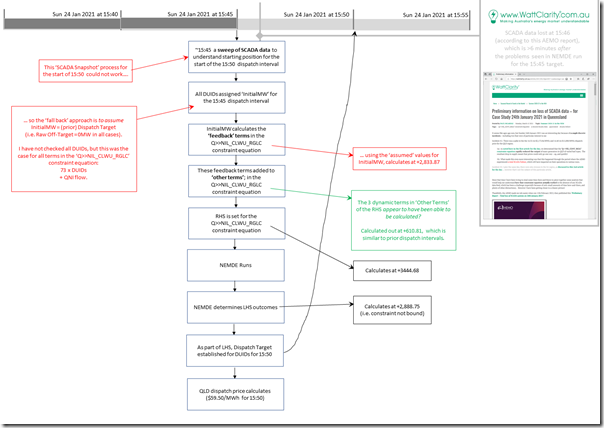
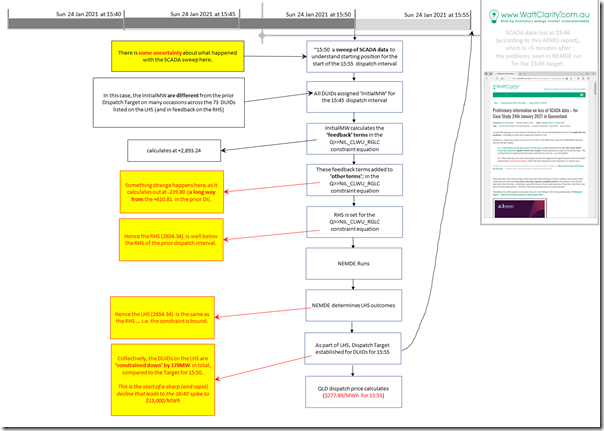
As we tick into the 15:50 dispatch interval, the AEMO tries to complete the same kind of ‘SCADA Sweep’ process to set InitialMW … but this does not appear to have worked.
Instead, out understanding is that the AEMO (following procedure) assumes that the InitialMW was equal to the prior Dispatch Target for each of the units:
(a) This was certainly the case for the 73 x DUIDs in this equation;
(b) In this instance it appears that QNI was also affected (i.e. the ‘Metered Flow’ is identical to the prior Target).
(c) I did not check all the other DUIDs around the NEM.
However what’s a bit baffling at this point is that it appears that the AEMO was able to update the ‘Other Terms’ in the constraint equation … specifically:
Network Data Point #1) The emergency rating for the 8875 Raglan-Larcom Creek 275kV line (which we understand is one of the ones dynamically supplied by Powerlink)
Network Data Point #2) The MVA on 8875 275kV line at Raglan
Network Data Point #3) The MVA on 871 275kV feeder from Calvale (Line end switched MW)
I say that ‘it appears that’ because the aggregate number produced for ‘Other Terms’ here (i.e. 611MW):
(a) was similar to the number for 15:45 … and
(b) distinctly different from what happened at 15:55.
In the following image we see what happened within the interval, in terms of dispatch … with a couple questions flagged, about use of AGC (e.g. Regulation FCAS) and also functioning of AWEFS and ASEFS forecasts (and Targets delivered via SCADA to Wind Farms and Solar Farms).
Through this Dispatch interval, there were 79% of expected 4 second readings missing (i.e. just 1 fewer than the prior dispatch interval):
(D3) The 15:55 dispatch interval
In the 15:55 dispatch interval, there are more things that we don’t really understand, as highlighted:
As noted here, we see something different than for the prior dispatch interval:
1) We see that the DUID Initial MW values (and QNI flow) are different from the prior Dispatch Target … suggesting that the ‘SCADA Sweep’ was able to work and hence Aggregate ‘Feedback Terms’ appears real;
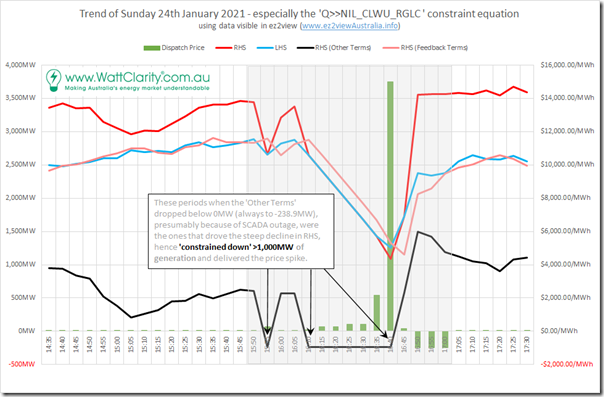
2) However something quite odd appears to have happened with the Aggregate ‘Other Terms’ as this now calculates to be –239MW (which is a net change of –840MW on what it had been for the prior dispatch interval).
The net effect of this is that it drives the RHS down by 790MW which is a large amount – which binds the ‘Q>>NIL_CLWU_RGLC’ constraint equation.
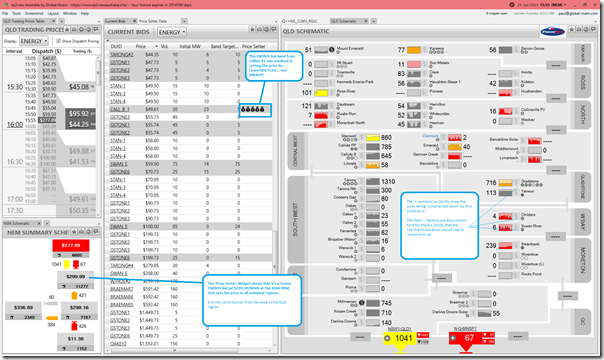
In terms of price outcomes, the dispatch price spikes to $277.89/MWh. However this snapshot from ez2view at the 15:55 dispatch interval shows that the elevated price was seen in other regions, and that the price outcome in QLD was due to a Snowy Hydro unit setting the price (mostly).
We’ll look at some of these further (time permitting) in the up-coming Part 4 of this Case Study.
(D4) The 16:00 dispatch interval
Dispatch price drops to $60.80/MWh as the constraint unbinds.
It appears that this occurs coincident with (perhaps partly because of?) whatever was going awry with SCADA and jamming the ‘Other Terms’ collectively at –239MW has been alleviated, raising that figure to a more ‘normal’ level of 566MW.
(D5) The 16:05 dispatch interval
The dispatch price remains at ‘normal’ level – at $55.68/MWh.
The Aggregate ‘Other Terms’ calculates out to be +565.51MW … so more like what it had been before 15:55 (but this is the last time it happens for a while).
(D6) The 16:10 dispatch interval
Dispatch price climbs to $100.00/MWh.
We see the Aggregate ‘Other Terms’ is again jammed down at –238.9MW (i.e. exactly the same as 15:55 – and also the same as subsequent dispatch intervals). Because of this subtraction from the RHS calculation, the RHS value drops and the constraint is bound (Marginal Value is only –65.01, a relatively minor amount).
(D7) The 16:15 dispatch interval
Dispatch price climbs to $279.43/MWh.
We see the Aggregate ‘Other Terms’ is again jammed down at –238.9MW.
1) Another –238.9 is subtracted off the aggregate RHS limit
2) This translates to a reduced aggregate Target from the 73 DUIDs in the constraint of 62MW (hint –> it’s a different number partly because of the factors <1, but also because QNI is in the equation).
3) The constraint binds more severely – with Marginal Value at –289.51.
(D8) The 16:20 dispatch interval
Dispatch price at $288.00/MWh.
We see the Aggregate ‘Other Terms’ is again jammed down at –238.9MW.
1) Another –238.9 is subtracted off the aggregate RHS limit
2) This translates to a reduced aggregate Target from the 73 DUIDs in the constraint of 85MW (hint –> it’s a different number partly because of the factors <1, but also because QNI is in the equation).
3) The constraint binds more severely – with Marginal Value at –1,288.01.
(D9) The 16:25 dispatch interval
Dispatch price climbs above the $300/MWh cap payout price, to $411.98/MWh.
We see the Aggregate ‘Other Terms’ is again jammed down at –238.9MW.
1) Another –238.9 is subtracted off the aggregate RHS limit
2) This translates to a reduced aggregate Target from the 73 DUIDs in the constraint of 216MW (hint –> it’s a different number partly because of the factors <1, but also because QNI is in the equation).
3) The constraint binds more severely – with Marginal Value at –1,412.27.
(D10) The 16:30 dispatch interval
Dispatch price climbs to $426.96/MWh.
We see the Aggregate ‘Other Terms’ is again jammed down at –238.9MW.
1) Another –238.9 is subtracted off the aggregate RHS limit
2) This translates to a reduced aggregate Target from the 73 DUIDs in the constraint of 237MW (hint –> it’s a different number partly because of the factors <1, but also because QNI is in the equation).
3) The constraint binds more severely – with Marginal Value at –1,434.14.
(D11) The 16:35 dispatch interval
Dispatch price spikes to $2,173.06/MWh.
We see the Aggregate ‘Other Terms’ is again jammed down at –238.9MW.
1) Another –238.9 is subtracted off the aggregate RHS limit
2) This translates to a reduced aggregate Target from the 73 DUIDs in the constraint of 338MW (hint –> because DUIDs with factor 1 have already been ‘constrained off’ this number is growing because DUIDs with lower factors are being affected).
3) The constraint binds more severely – with Marginal Value at –15,754.38.
(D12) The 16:40 dispatch interval
Dispatch price spikes further, to $15,000/MWh.
We see the Aggregate ‘Other Terms’ is again jammed down at –238.9MW and that the constraint is violated.
1) Another –238.9 is subtracted off the aggregate RHS limit
2) This translates to a reduced aggregate Target from the 73 DUIDs in the constraint of 299MW (which is lower than the 338MW above … but keep in mind that there is a negative headroom on this occasion on the constraint, as NEMDE could not find a feasible solution without violating this constraint).
3) The constraint binds more severely – with Marginal Value at –450,000 (and Violation Degree being 169.82).
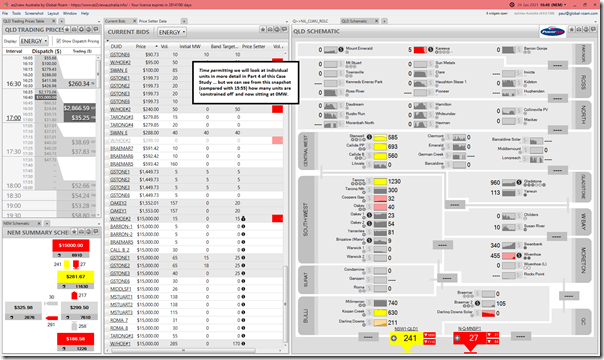
Here’s the equivalent view from ez2view, which I have added in here so readers can see how many units are sitting at 0MW (i.e. typically the ones with the factors near +1.0):
We’ll explore individual units in Part 4 of this Case Study, if time permits.
(D13) The 16:45 dispatch interval
Dispatch price drops down to $150.01/MWh – which appears to have happened as whatever was going awry with SCADA and jamming the ‘Other Terms’ collectively at –239MW has been alleviated, delivering a net change of +637MW of increased RHS (even though the ‘Feedback Terms’ had reduced further).
(D14) The 16:50 dispatch interval
The dispatch price drops to –$1,000/MWh as generators rebid to try to capture the value in the half-hour (these behaviours will be explored further in Part 4 of this Case Study, as time permits).
It appears to us that SCADA issues are resolved before 16:45 (i.e. in time for this dispatch run).
(D15) The 16:55 dispatch interval
The dispatch price remains down near the Market Price Floor.
(D16) The 17:00 dispatch interval
The 17:00 dispatch interval also represents the end of the 17:00 trading period, where the trading price calculates out to be $2,387.18/MWh as a result of two elevated prices at the start of the trading period.
The AEMO Preliminary Report indicates that SCADA issues were resolved by 16:56 (i.e. in this dispatch interval), but the evidence we’ve looked at suggest that, at least in terms of this constraint, the issues had been resolved ~12 minutes prior to this time.
(E) Summing up what happened to the ‘Q>>NIL_CLWU_RGLC’ constraint equation
Having worked through the above, here’s a graphical summary of what we have deduced:
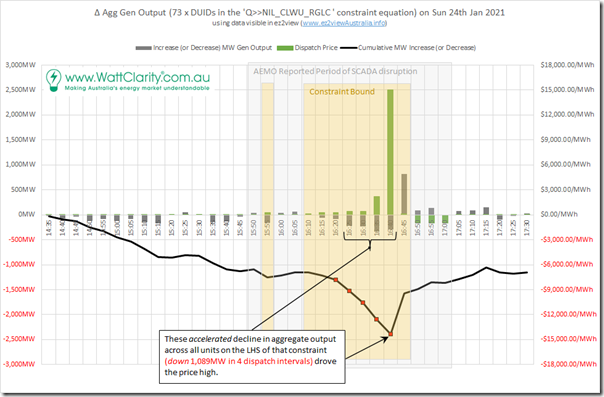
Finally, here’s another chart that sums up (for the same 73 x DUIDs contained in the LHS – and the RHS for feedback – of this constraint equations) the relative and cumulative change in aggregate output across the time range. It’s quite apparent from this chart how the 1,087MW collective reduction in output (driven by the –238.9MW value for ‘Other Terms’ on the RHS) was a primary driver for the price spike:
Note that the drop in generation was less than the drop in the RHS … because of the factors on the LHS of the constraint (i.e. most <1.0 and some negative) and also because of the presence of QNI in the constraint equation. Very interested to hear from those who can help us understand* more about what happened on this afternoon … including any mistakes we might have made!
* if you know of people who can help us, please let us know (or point them our way)?
(F) What’s next?
With this (Part 3) article out of the way, if time permits we’ll look forward to taking a more focused look at the 73 discrete DUIDs listed on the LHS of the ‘Q>>NIL_CLWU_RGLC’ constraint equation (and on the RHS as well, by way of ‘feedback’):
1) in order to understand what actually happened*
* in attempting to do this we will need to keep in mind that InitialMW data points might not actually reflect what the unit was actually doing through the dispatch intervals noted as such in the table above.
2) … and also how they responded (e.g. through rebidding) as the situation developed.


From what I can see the emergency rating from PowerLink failed over to the static summer rating, which is generally quite conservative
This was discussed in this ‘Part 4’ article:
https://wattclarity.com.au/articles/2021/04/24jan2021-scadaoutage-casestudy-part4/