
An essential part of our price forecasts here at ITK is the volume of new variable renewable energy (VRE) that is entering the National Electricity Market (NEM). We keep an eagle eye on near term project developments and regularly review and revise our plant commissioning forecasts to provide an accurate view on new power supply over the coming quarters.
The results of our analysis on wind and solar project progress is plugged into our NEM price forecast model to generate generation mix forecasts and inform our view on future prices.
Key takeaways
- The final quarter of 2020 was massive for renewables in the NEM. In part we saw the unwinding of project connection delays, but we also saw the impact of very strong investor confidence in the sector.
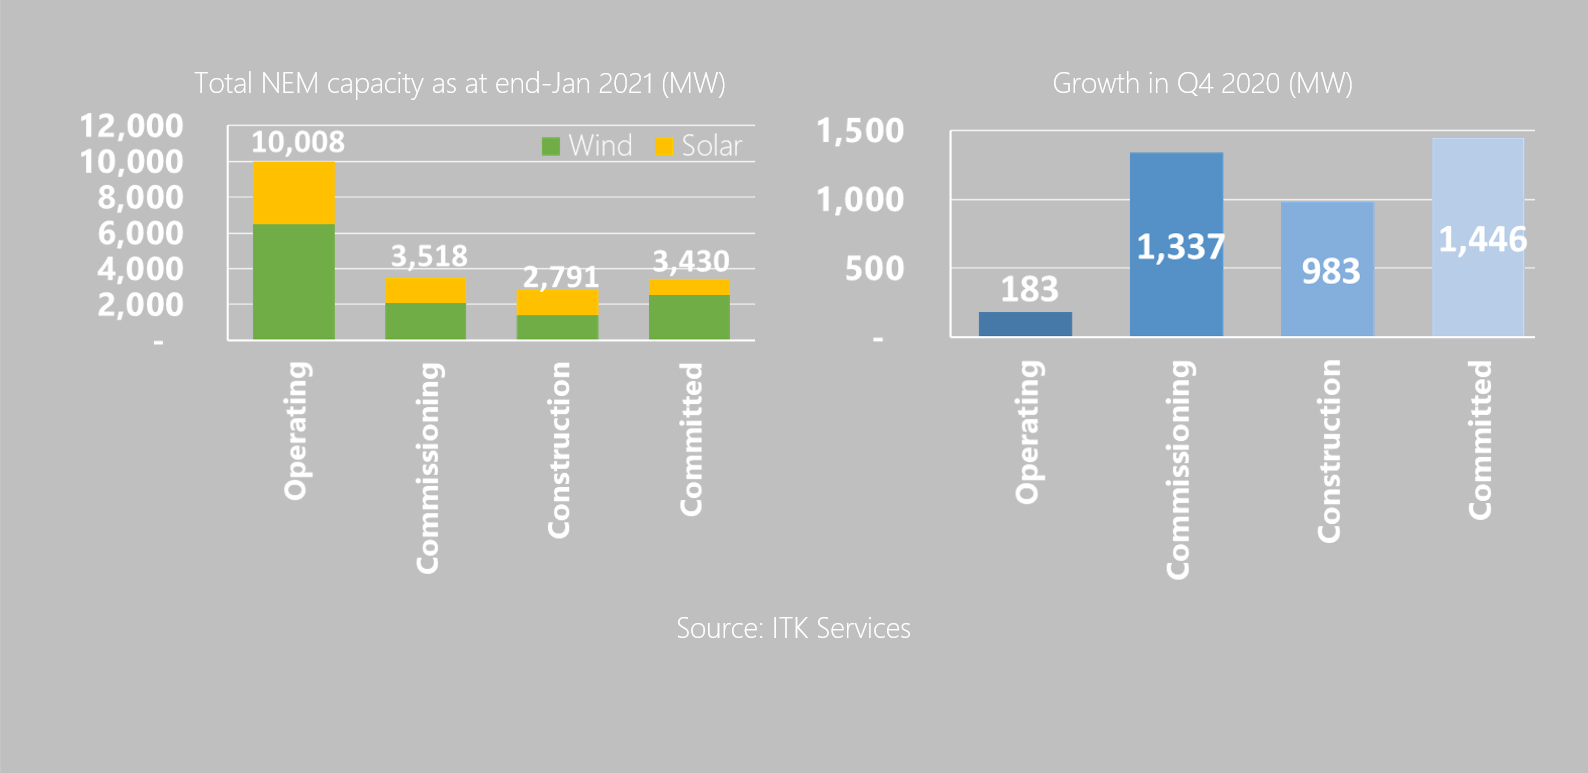
- Fully operational utility wind and solar capacity reached 10 GW for the first time, despite a relatively low level of fully commissioned capacity growth for the quarter (just 183 MW).
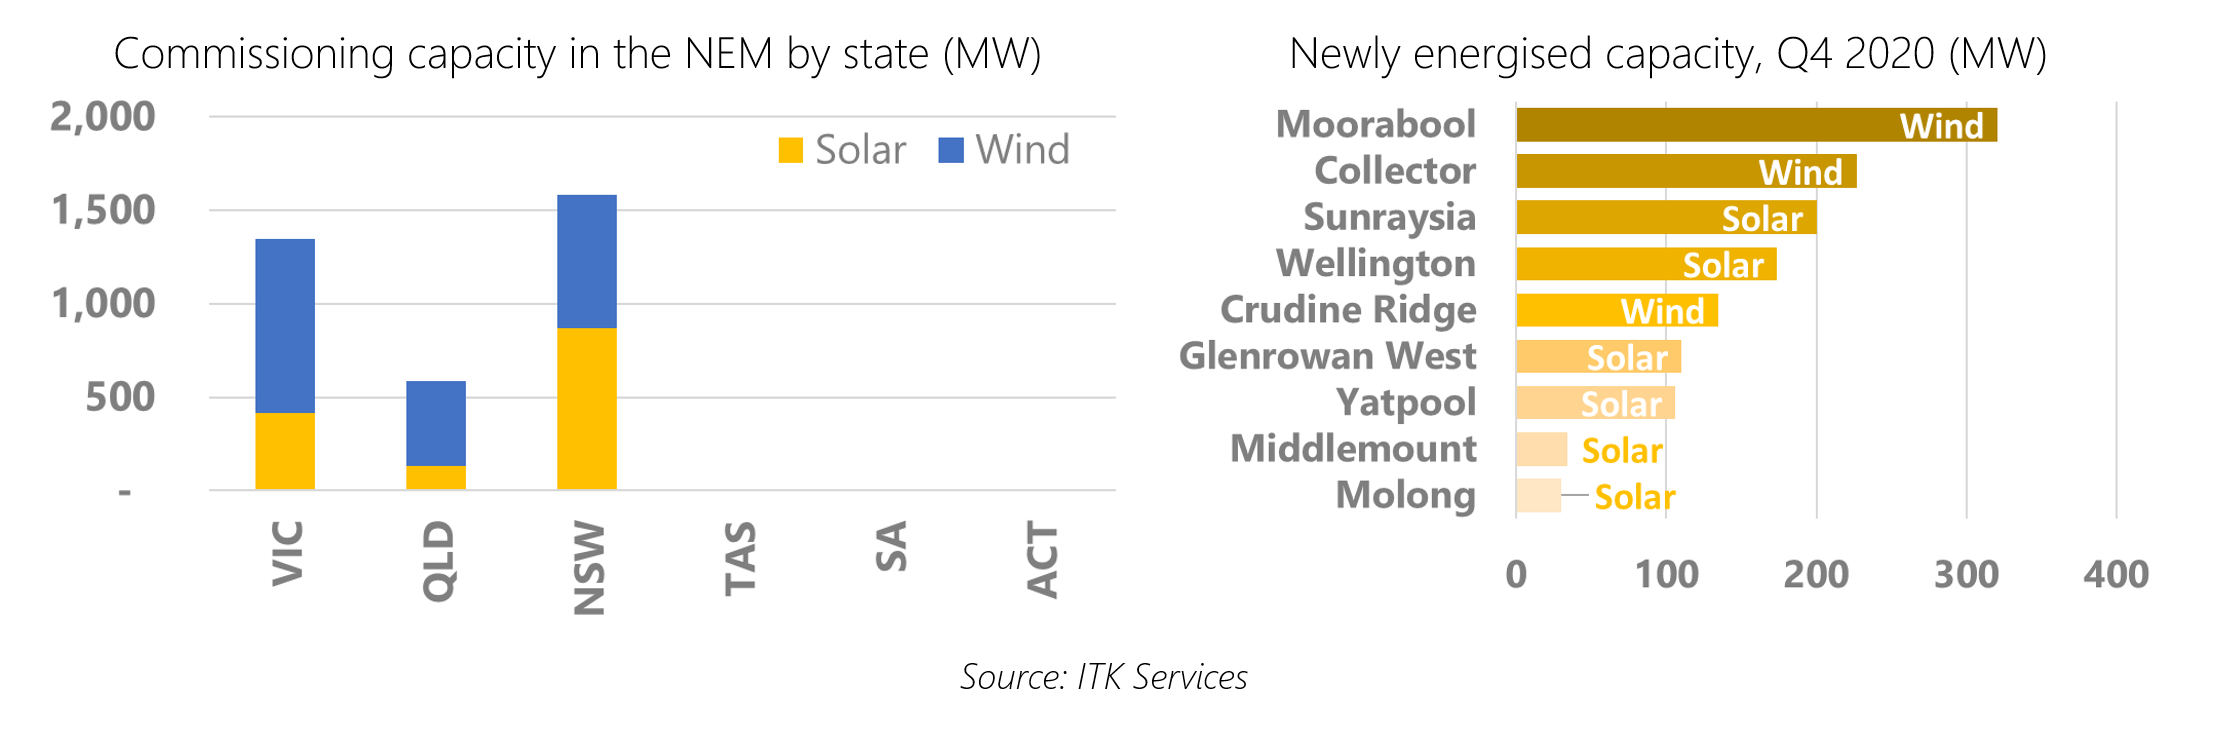
- New grid connections between October and December hit a huge 1.34 GW, making it the second highest quarter for energisations in the NEM. Nine projects started operations, of which the largest was the 321 MW Moorabool wind farm.
- In total for the year, 3.5 GW of capacity started operations, more than both 2018 and 2019.
- Construction activity bounced back with a vengeance after a very quiet first half of the year: we estimate almost 1 GW of capacity entered the build phase during Q4. This is the highest level of construction starts since the June 2018 quarter.
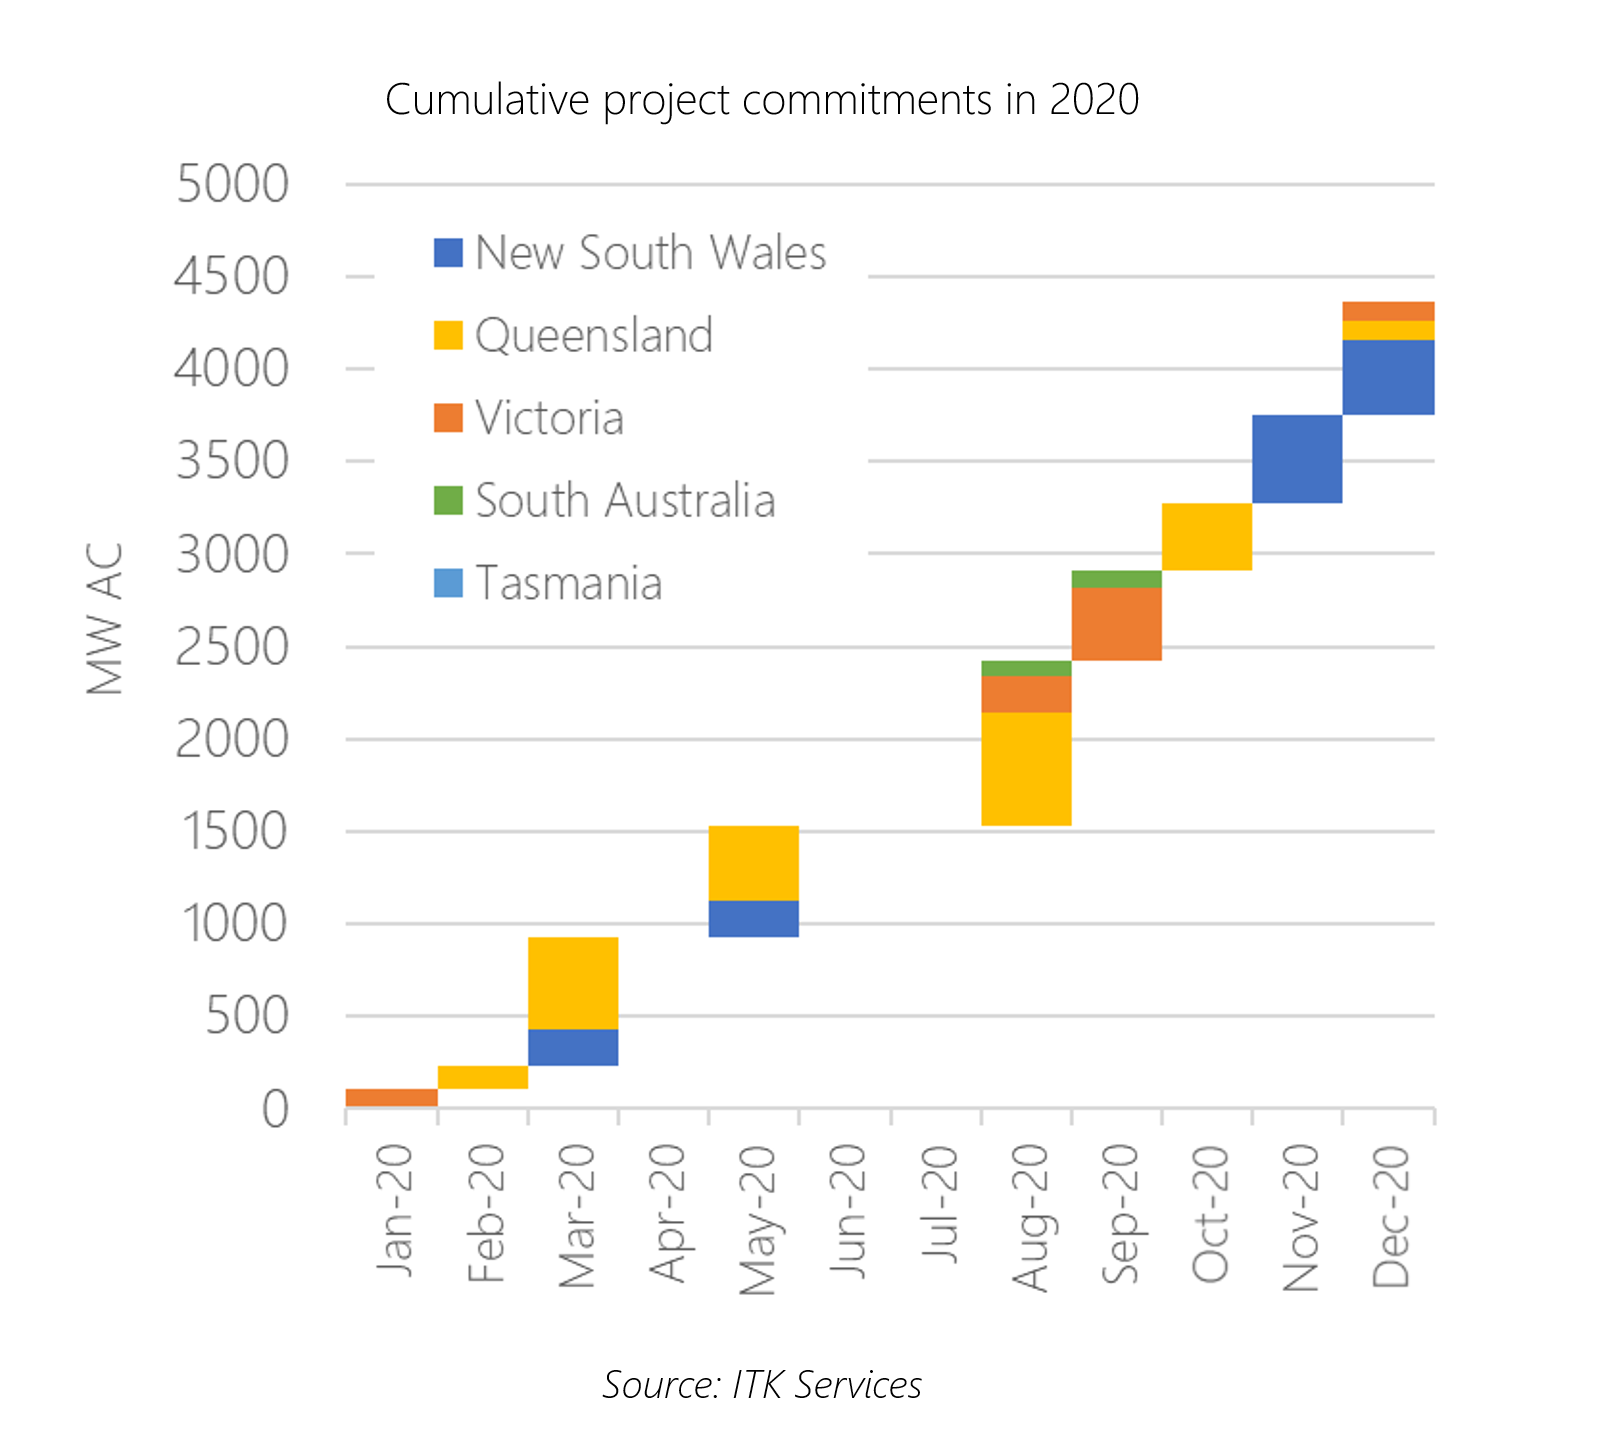
- And project commitments continued their remarkable trend, with 1.4 GW securing either a PPA or a connection agreement in Q4. This takes total capacity that was committed to construction in 2020 to a stunning 4.4 GW.
Operating capacity
It finally happened: in Q4 2020, the NEM achieved 10 GW of fully operational utility wind and solar capacity. The contribution of fully commissioned capacity during the quarter was relatively small, at 183 MW, but took the annual total for 2020 to 1.4 GW.
This is lower than for both of the previous two years, largely as a result of delayed commissioning at a couple of very large wind farms. Had Dundonnell (VIC) and Coopers Gap (QLD) ramped up slightly faster, 2020 would have easily been a record year for operating capacity.
If we broaden our definition of operating assets to include the nameplate capacity of all projects that are producing energy, no matter their commissioning stage, then the NEM currently has 13.7 GW AC of installed wind and solar. This illustrates the size of the commissioning task currently underway, and which we expect to be largely completed during 2021.
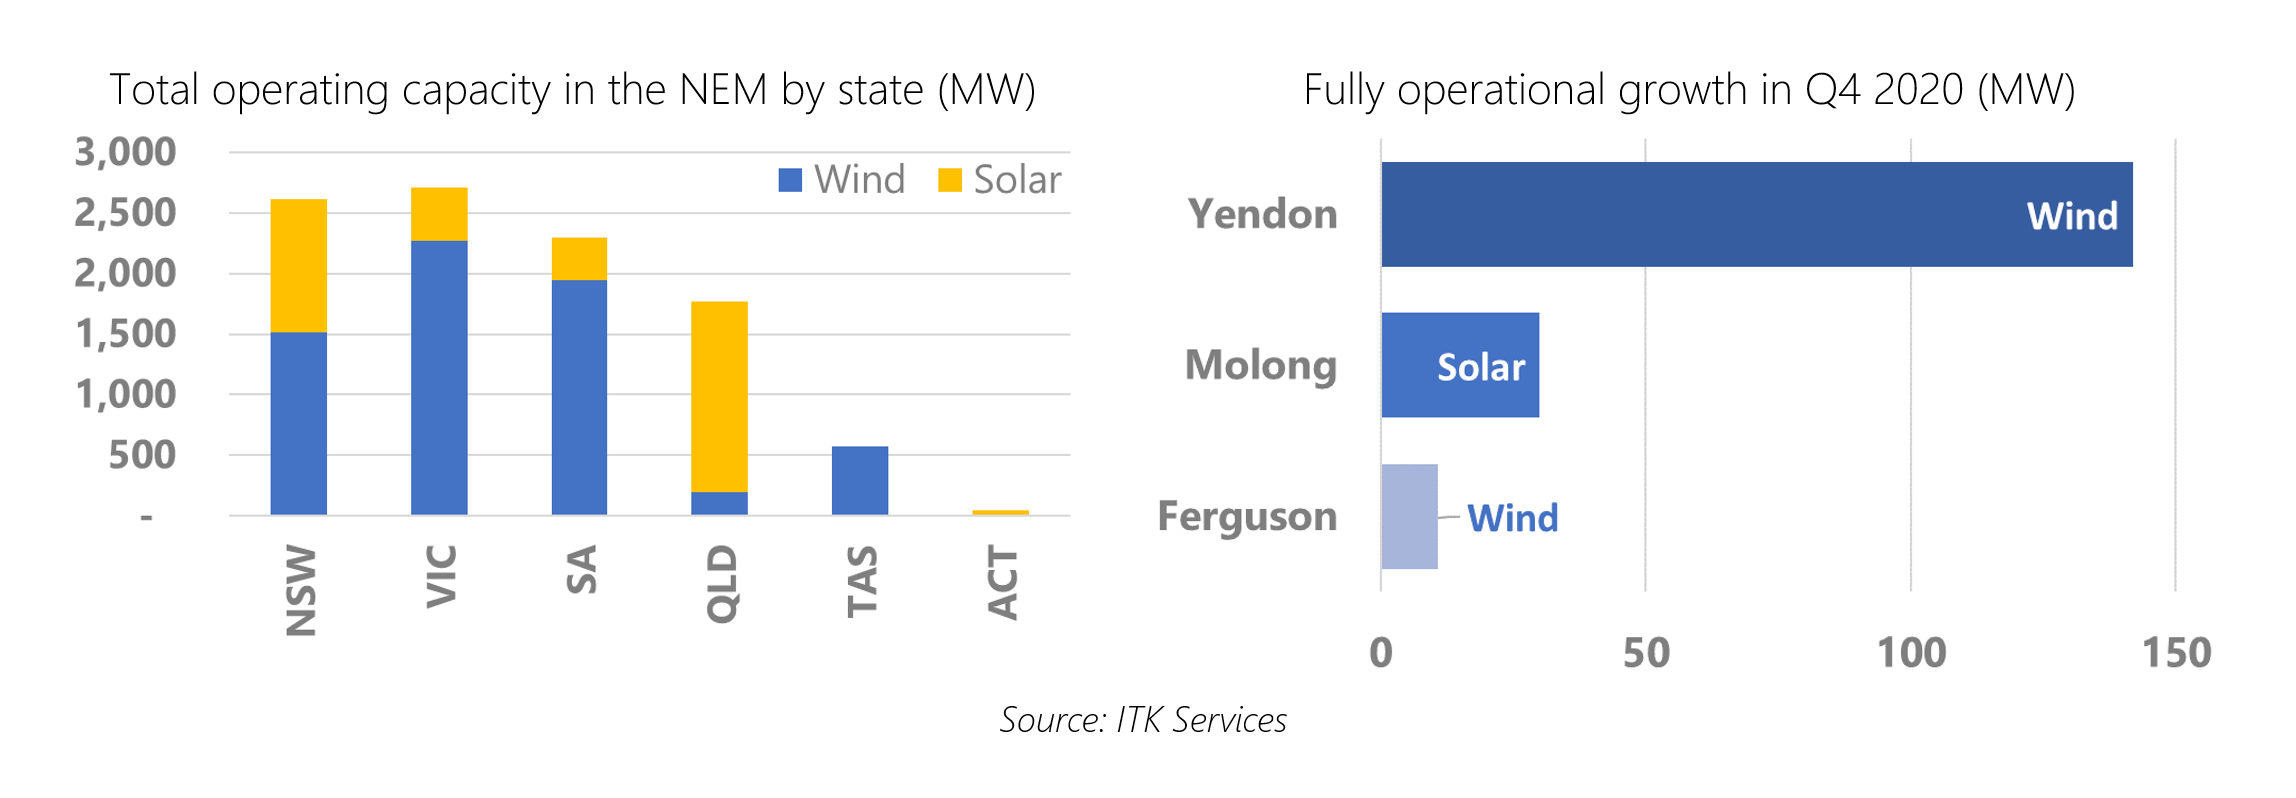
Three projects were fully commissioned during Q4, and capacity was dominated by the Yendon wind farm in Victoria. Yendon is the 142 MW phase of the broader Lal Lal development; the other phase is the Elaine wind farm currently being commissioned. It took less than a year to construct Yendon, but commissioning stretched for 16 months by our estimates; we expect this balance is fairly rare, and reflects the widespread difficulties the Victorian grid and market operator has had absorbing new volumes in 2020.
The 30 MW AC Molong solar farm in New South Wales also hit maximum production during the quarter, taking only seven months from construction start to full commissioning. This makes it one of the fastest builds in our project database. Finally the 11 MW unscheduled Ferguson wind farm was commissioned in Victoria.
Project commissioning data so far makes us confident Q1 2021 is going to be big for wind and solar assets reaching full output. We expect several large assets to be fully commissioned over the next three months, and flag the following as ones to watch out for:
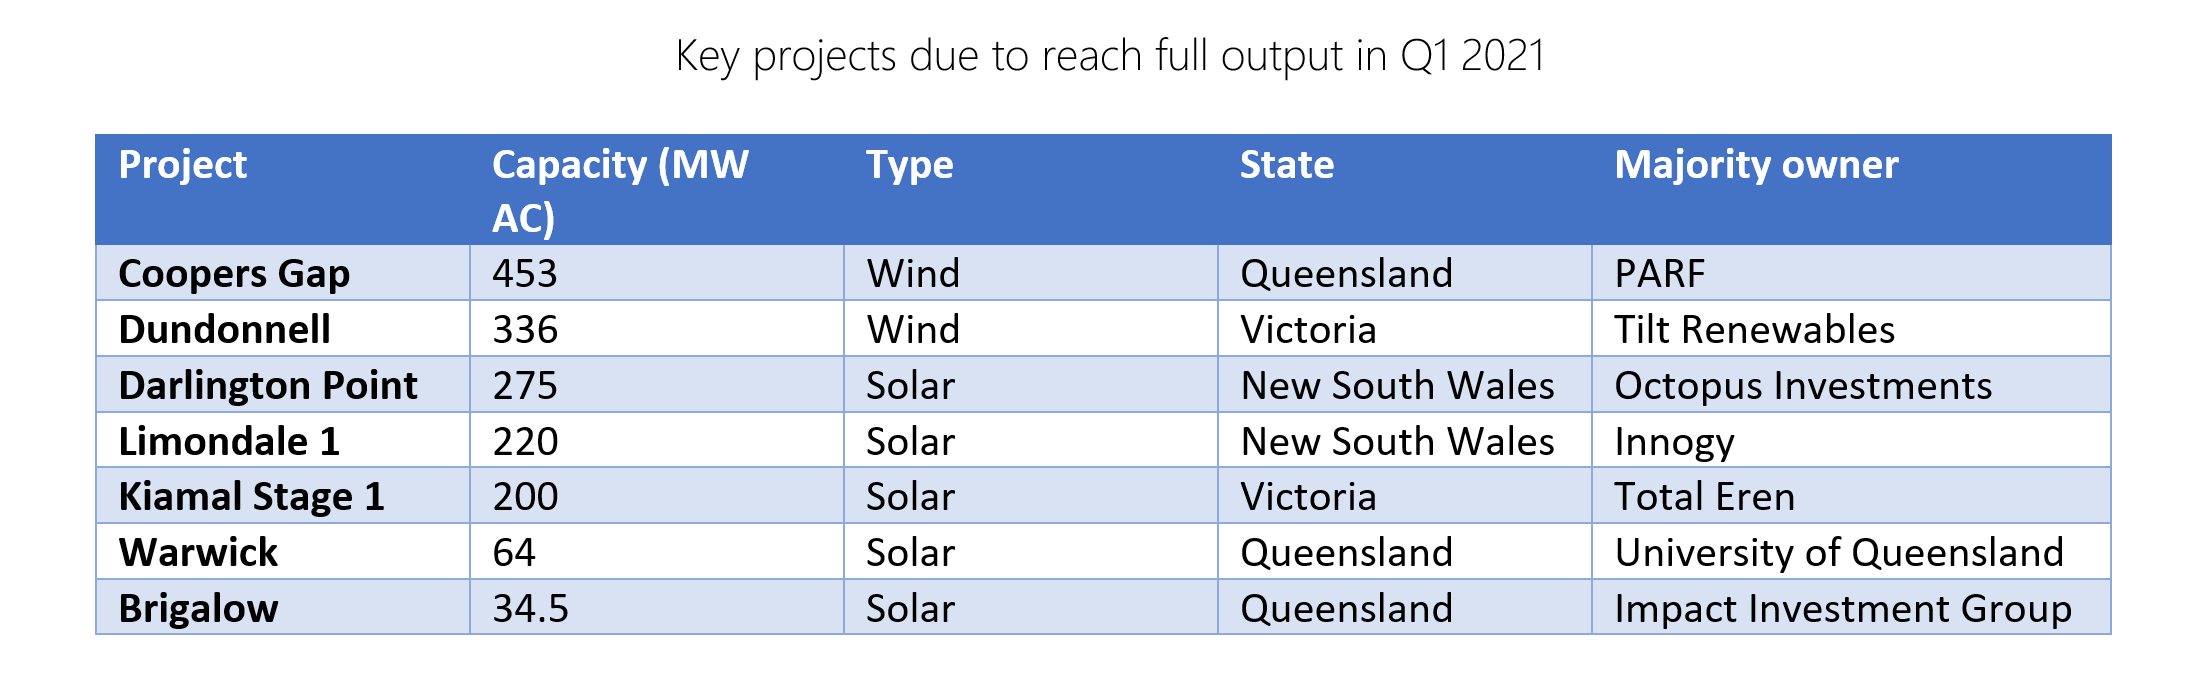
If all seven are fully commissioned before the end of March, Q1 2021 will be easily the biggest quarter we have on record for new output growth, at over 1.5 GW AC. This represents the unwinding of the discrepancy through 2020 of the high volumes of newly energised projects and the relatively low volumes of projects reaching full output.
We are acutely aware of the risk of timetable slippage; some projects may slip months, potentially into the following quarter, but we consider it unlikely that any will still be commissioning beyond the mid-year point.
Commissioning
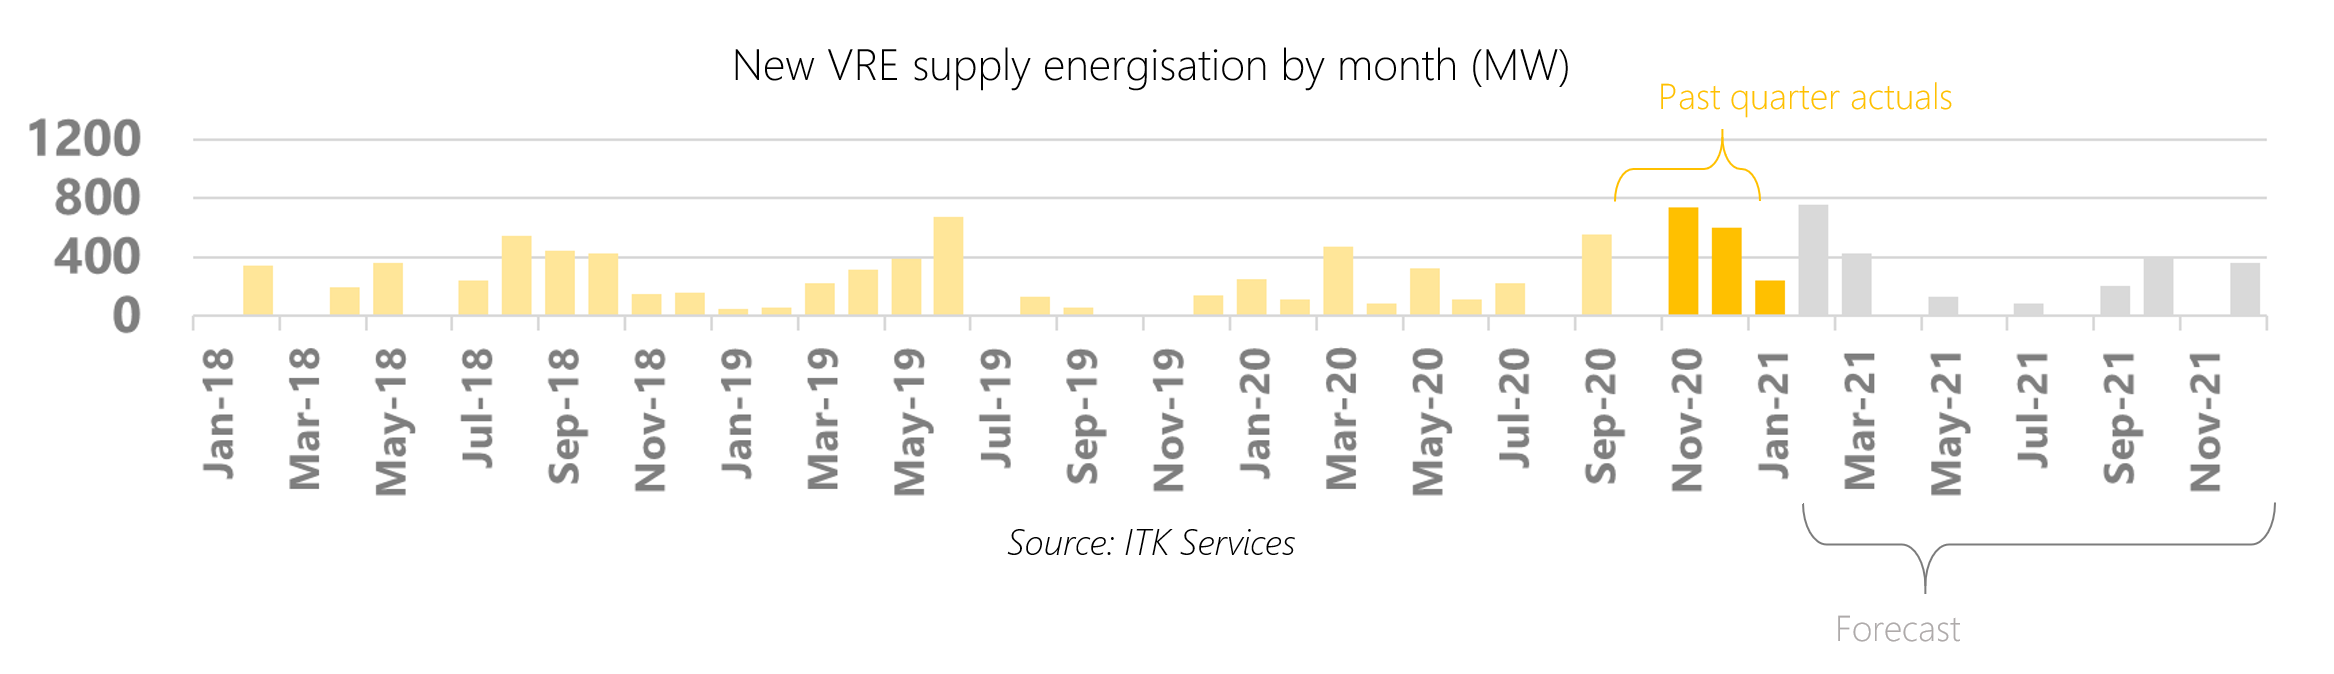
The biggest story from Q4 2020 was the massive volume of project capacity that energised for the first time. We count 1.34 GW AC that started sending power to the grid during the quarter, making it the second highest quarter ever (behind only June 2019, at 1.37 GW).
Newly energised capacity was fairly evenly split between wind and solar. The Moorabool wind farm in Victoria topped the list at 321 MW, and was joined by the Collector (227 MW) and Crudine Ridge (135) wind farms in New South Wales.
Six solar farms joined the grid between October and December, the largest of which was the long awaited 200 MW AC Sunraysia in New South Wales.
Some of these assets moved fairly quickly through construction to energization: Molong took approximately 7 months, helped in part by its size (30 MW AC). Wellington and Glenrowan West both took around 11 months, which is more than respectable considering they are 174 and 110 MW AC respectively.
But other assets on the list help illustrate the difficulties in getting onto some parts of the grid, even by late 2020. Sunraysia took over two years from construction start to energization, and Yatpool in Victoria took a similar length of time. Both assets will have been impacted by AEMO’s queueing system for new connections in Victoria and south west New South Wales.
This bumper quarter for connections means the NEM now features 3.5 GW of capacity progressing though the commissioning phase, largely centered in New South Wales and Victoria.
Despite implementing delays in our grid connection estimates for forthcoming projects, we still forecast Q1 2021 to be a record quarter for energisations, at 1.4 GW. We have already seen 244 MW connect in January, and we expect the rest of the quarter to feature some large assets including the Berrybank Stage 1 and Mortlake South wind farms in Victoria.
And while there is a limit to the number of times we can write in these notes that we expect Stockyard Hill to come online, we do currently have it slated for February. It has to come soon, doesn’t it? The country’s biggest committed wind project is also in Victoria, and perhaps that in itself flags a risk to our energization forecast.
For the rest of the year, we anticipate a slower rate of new connections (in the absence of slippages from Q1), reflecting the relatively low level of projects that entered construction in the first half of 2020.
Construction
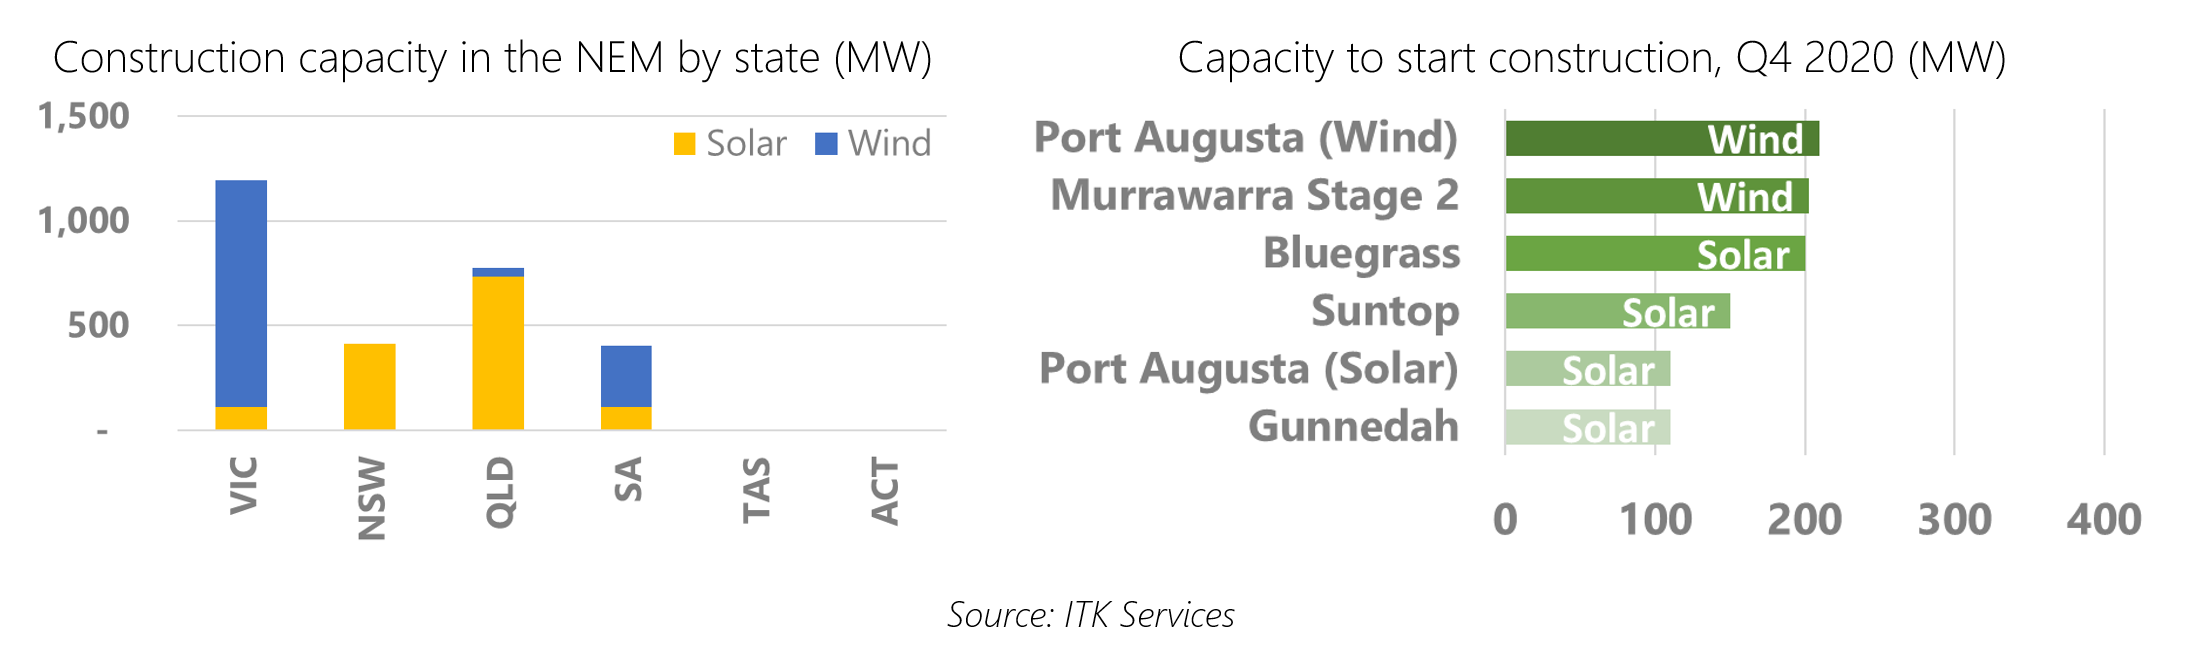
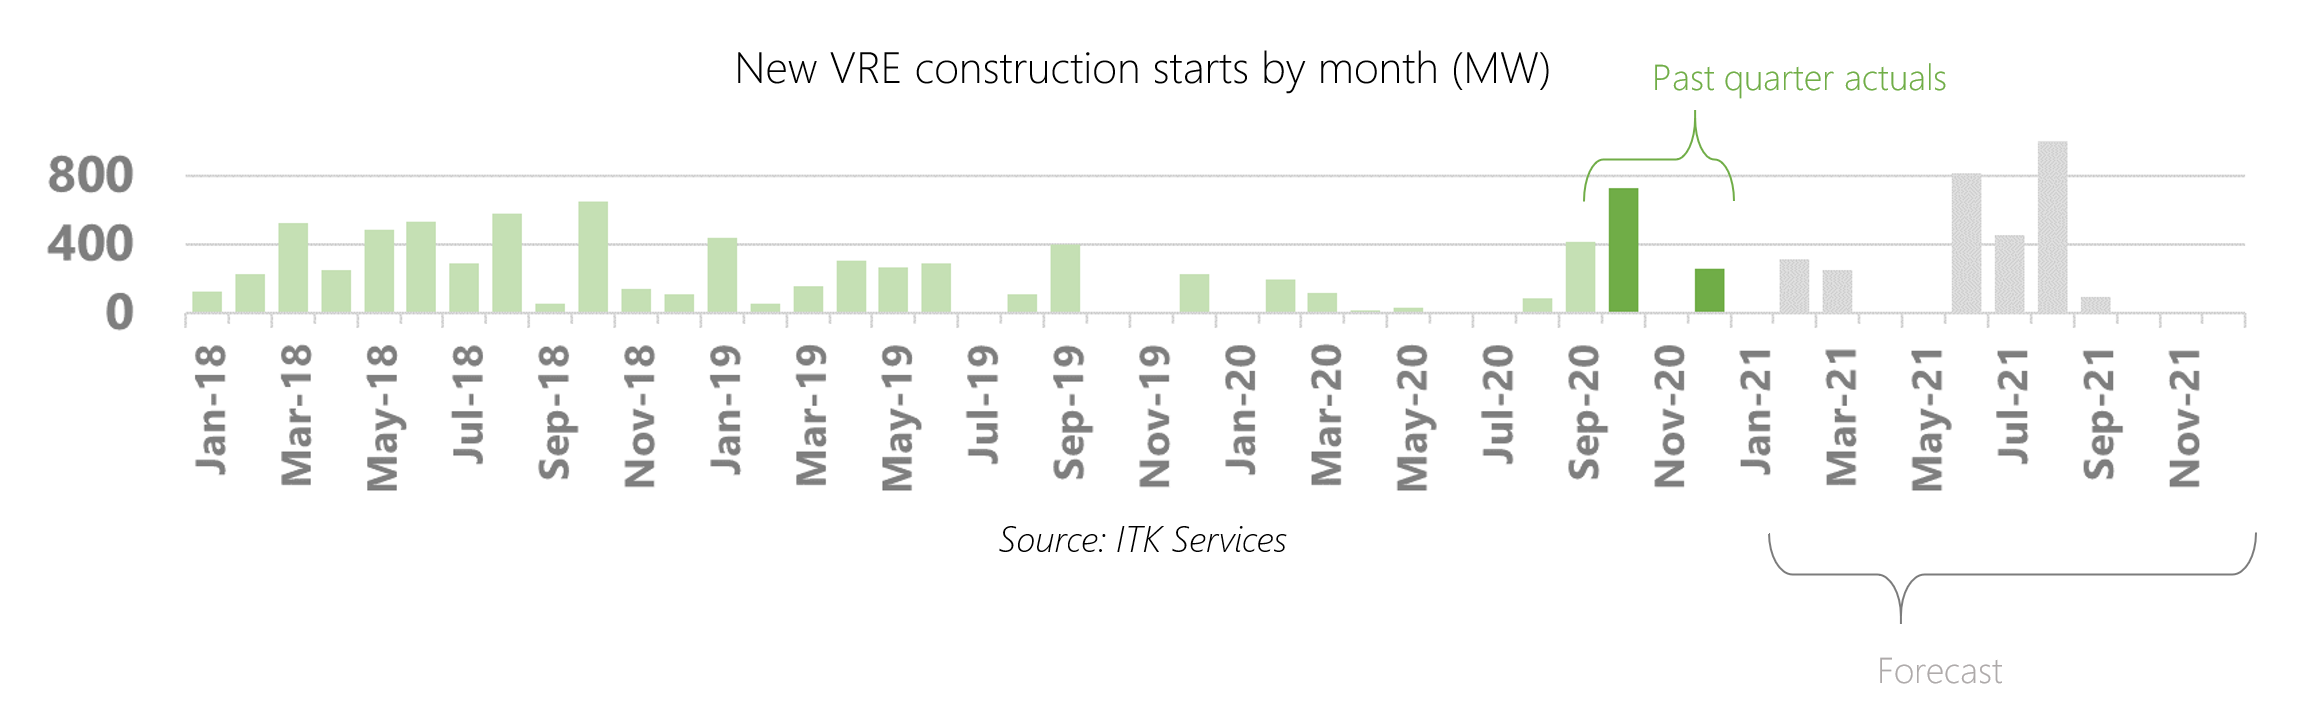
Although it was a slow start to the year, construction picked up markedly in Q4 2020. We estimate almost 1 GW broke ground, the highest level since June 2018. This represents an incredible swing in confidence in the Australian renewables sector.
We estimate there is now 2.8 GW under construction across the NEM, with Victoria leading the way courtesy of over 1 GW of wind being built.
Construction started on six projects between October and December, three of which were 200 MW or greater. The two largest are both wind farms: Port Augusta in South Australia and Murrawarra Stage 2 in Victoria. The four solar farms are all in excess of 100 MW AC, which is a remarkable result in it’s own right.
Forecasting construction starts for new projects is a bit like throwing darts at a dartboard, so we highlight the risks around these estimates. While we are unlikely to get the month of construction commencement correct for each project, we expect the middle of 2021 to be big. We anticipate several large projects kicking off around that time, dominated by wind capacity, including 502 MW from two tranches of the MacIntyre project in Queensland; the 450 MW Clarke Creek project and 400 MW Rye Park wind farm.
Other commitments
Q4 was another mammoth quarter for new project commitments, with 1.4 GW of capacity signed up for PPAs or connection agreements. This is the same volume as the previous quarter, and is another indicator of the incredible momentum behind project development today.
In total we now estimate 3.4 GW of capacity is at the committed stage (i.e. pre-construction). These may have achieved financial close but are yet to break ground, or they could be pre-financing but with a credible PPA in place. Alternative but less common triggers for us to consider a project committed is a transaction with clear intent to construct; a grid connection agreement; or an EPC contract.
Sticking to the unintentional theme of this note, the top two projects in this category are again wind farms. Goldwind’s Coppabella is the largest at 482 MW, with Tilt Renewables’ Rye Park weighing in at 400 MW. The largest solar project to be committed during the quarter is X-Elio’s 200 MW Bluegrass in Queensland, which entered construction almost simultaneously.
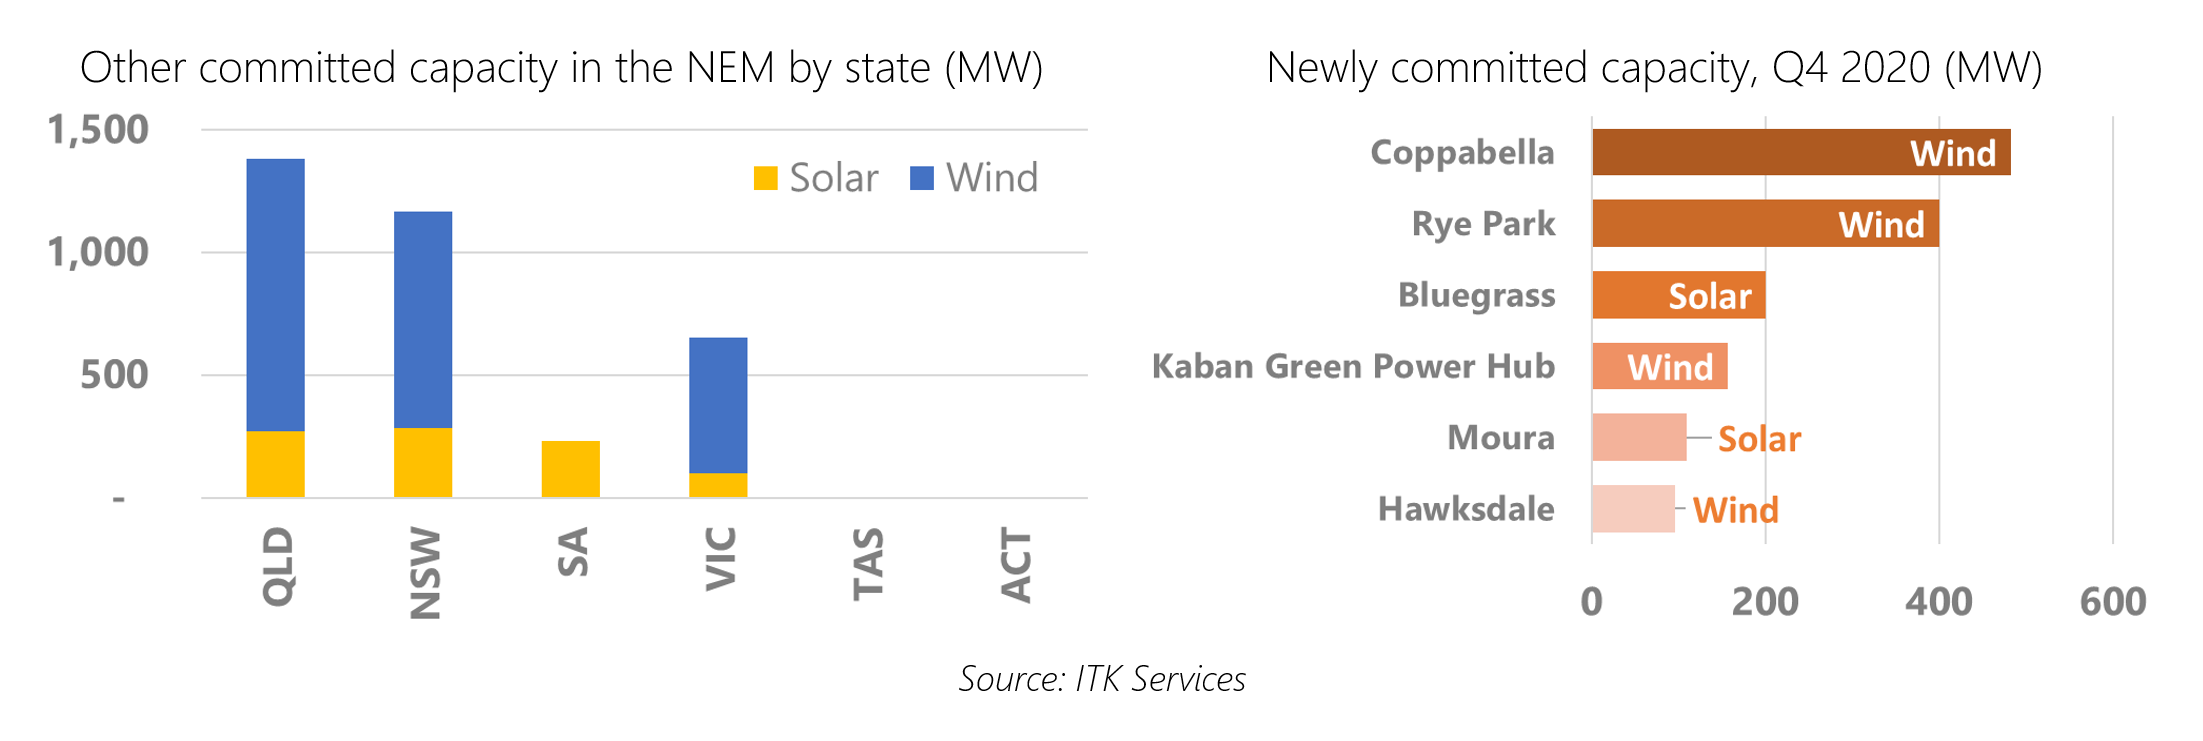
Total wind and solar project commitments for 2020 reached a stunning 4.4 GW, surely more than many expected at the start of the year. Most came in the second half (2.8 GW), and Queensland dominates (2.1 GW).
As we have flagged previously, we continue to review approximately 500 MW of projects which were committed in 2018 and 2019 but for which we have seen little to no progress since.
Outlook
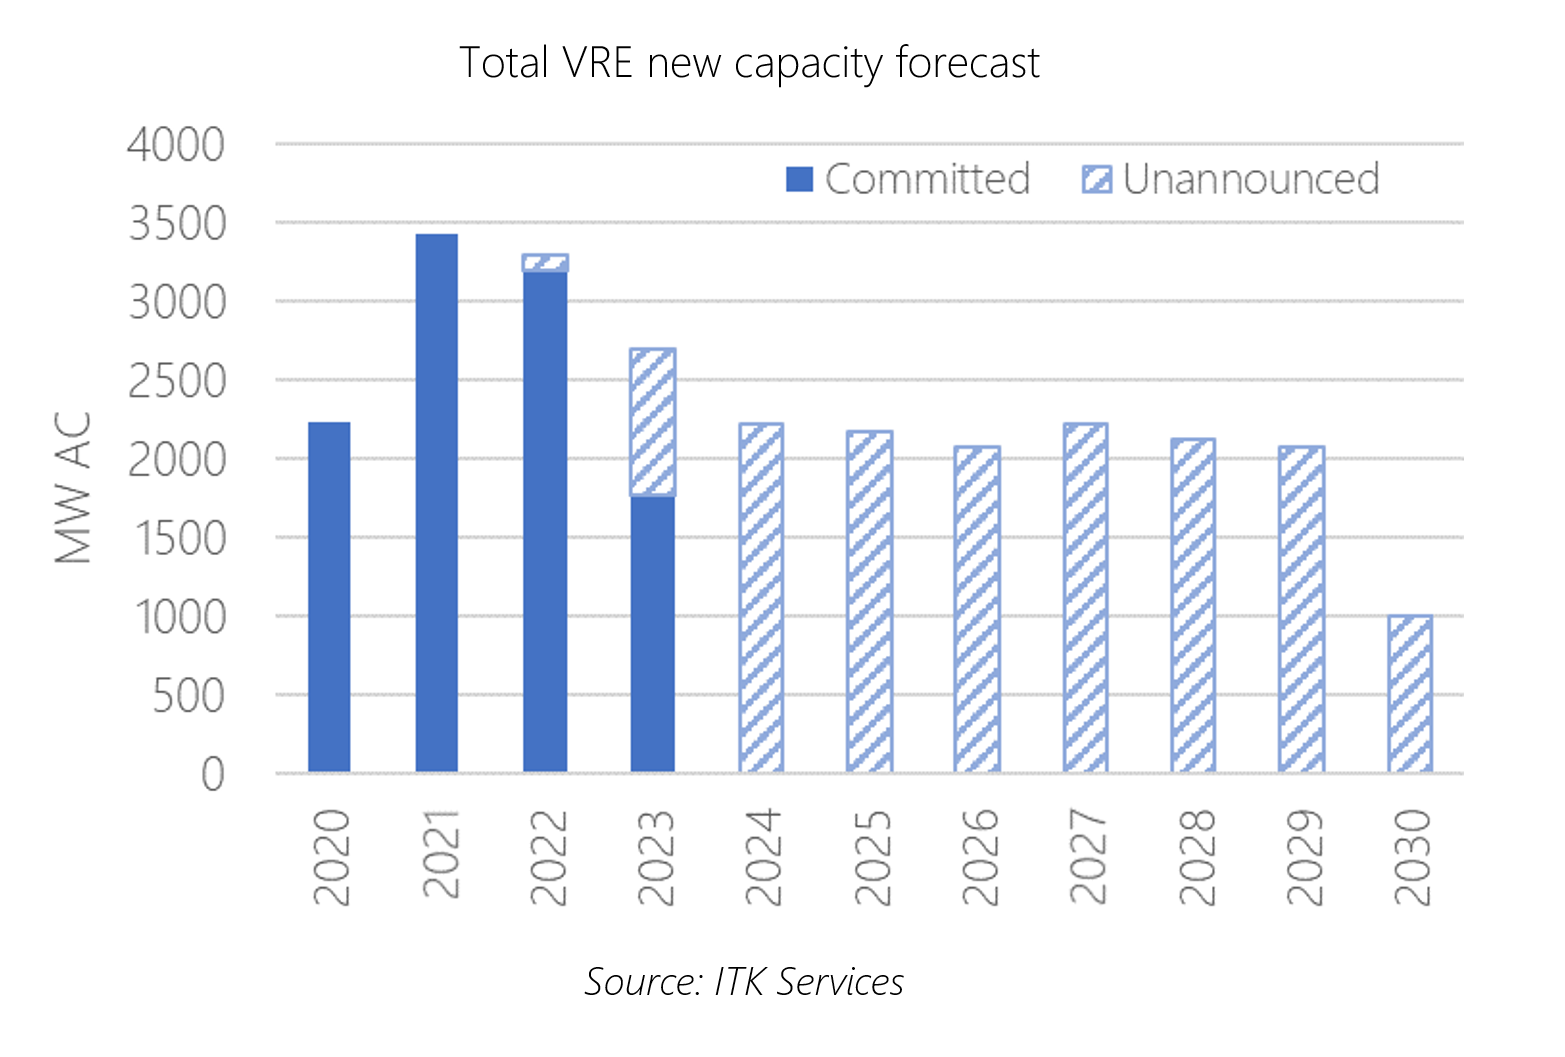
The next three years will be huge for utility renewables in Australia. Given the timeframes for financing, constructing and commissioning new plants, we expect all currently committed capacity to be fully online by the June 2024 quarter.
And that’s a lot of capacity. With 9.4 GW of projects either commissioning, being built or otherwise committed to construction, we expect fully operational wind and solar in the NEM to almost double from today’s level.
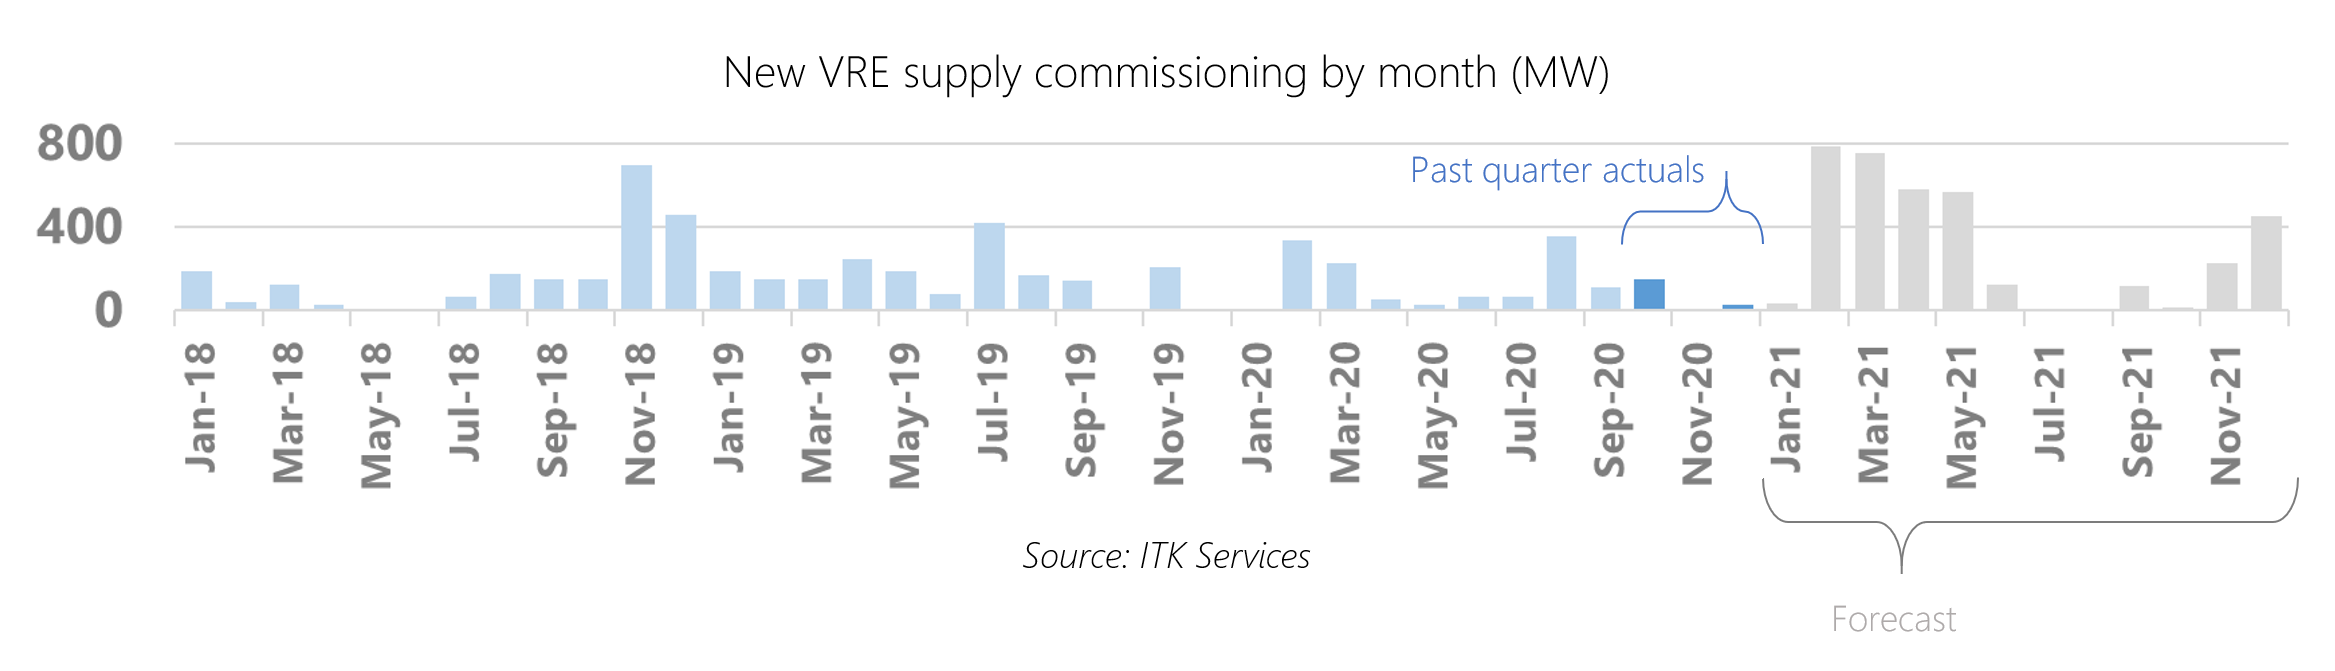
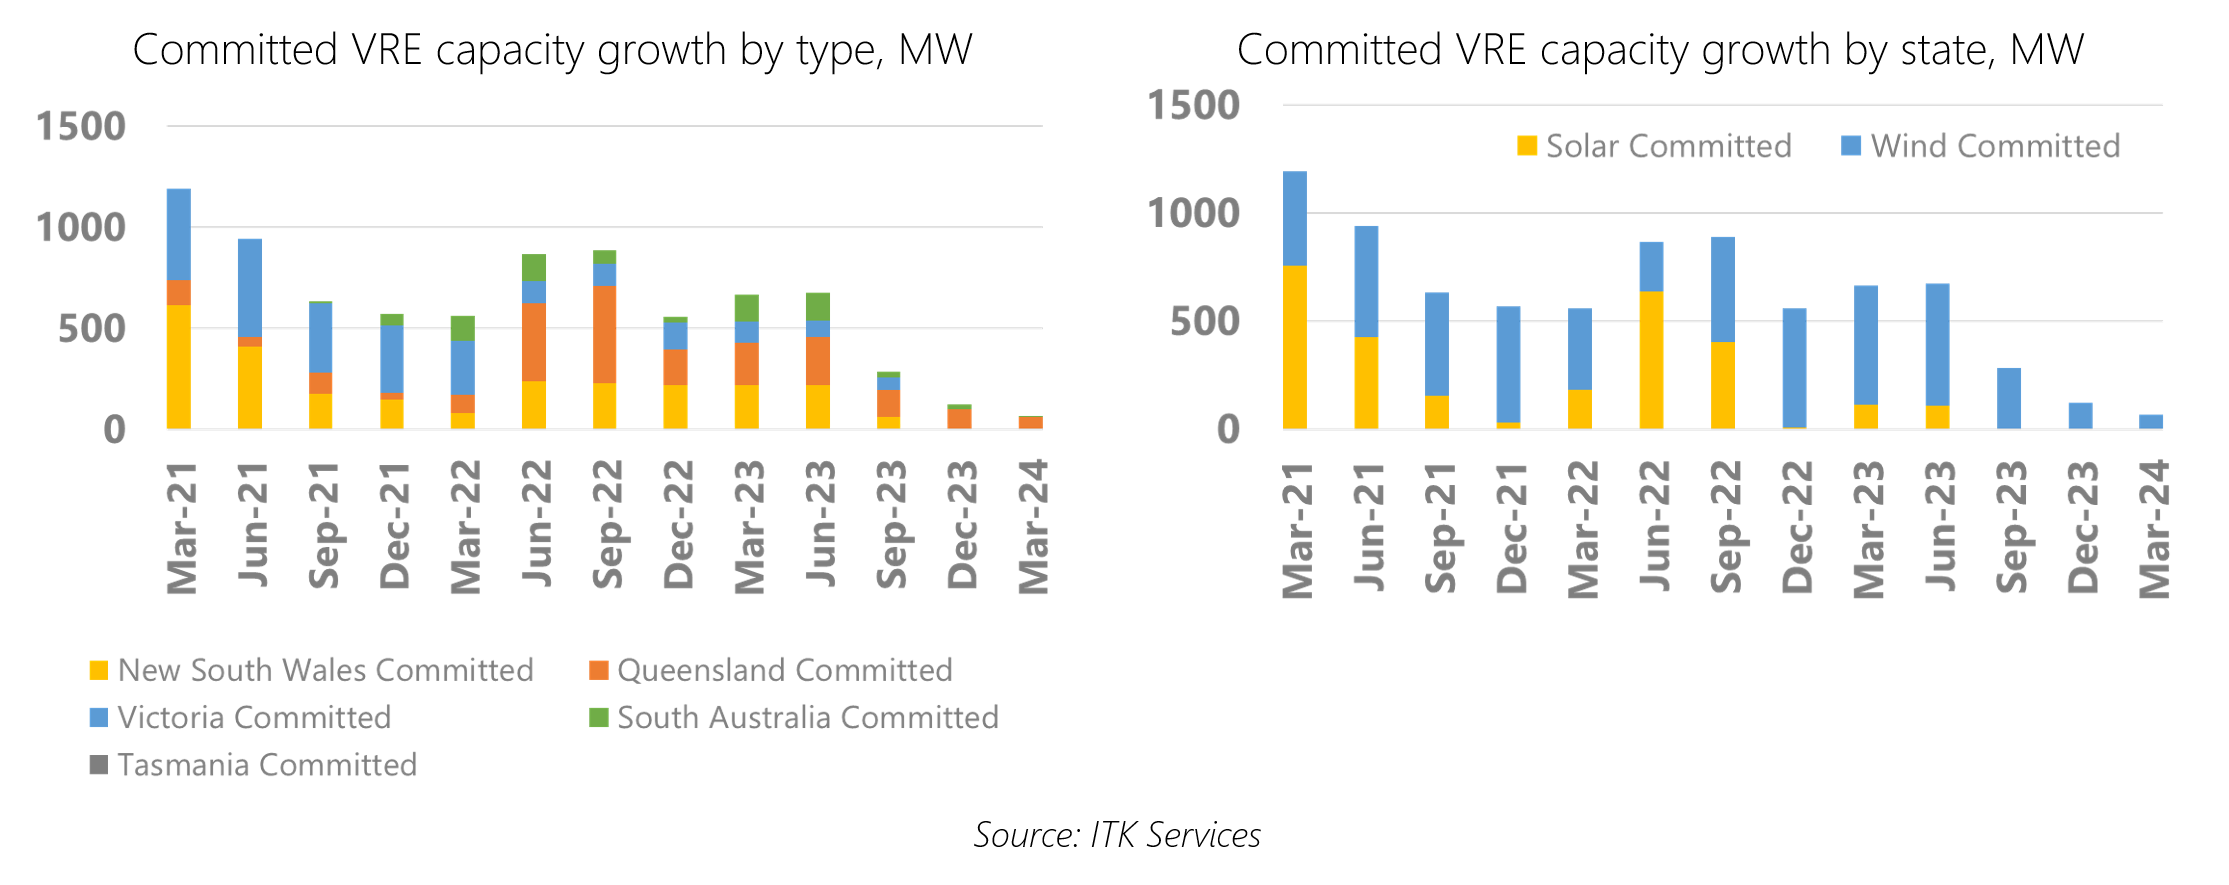
Our commissioning forecast is hostage to a whole host of risks, but we expect new volumes hitting the market to average between 500 MW and 1 GW per month for the next two years before slowly tailing off as committed projects reach completion.
Wind projects dominate the volume of new committed project capacity coming online, at approximately double the amount of solar. And New South Wales sees the most growth by state, despite the flurry of new commitments in Queensland through 2020.
Beyond formally committed projects, we also forecast longer term capacity growth from as-yet unannounced projects. Without picking individual project winners, we assume a level of capacity growth for each state, by technology type.
The biggest impact on our long-term capacity assumptions during our most recent forecast update was the New South Wales Electricity Infrastructure Roadmap. This new state government policy targets 11 GW of new wind and solar capacity to be under construction by 2030, most likely hosted within two new renewable energy zones (REZs). (There is also an allowance for a further 1 GW of projects currently committed but not yet operational, and we consider this to be covered already in our committed project forecast).
Along with capacity growth driven by state government targets in Victoria and Queensland, plus our assumption that corporate demand for clean energy contracts continues to grow, our forecasts get the NEM to approximately 50% renewables (including rooftop) by 2030.
About our Guest Author
 |
Ben Willacy is a consultant and analyst at ITK Services.
Ben has 18 years experience in global energy sector analysis, with experience across renewables, oil and gas, and coal. He co-founded Sustainable Energy Research Analytics (SERA), creating and maintaining the SERA Tracker product providing data and analysis on Australian wind and solar developments. Prior to this, Ben led Wood Mackenzie’s global coal supply team. You can find Ben on LinkedIn here. |
Installed capacity is meaningless.
All the renewable generation installed won’t benefit anyone when the wind stops blowing at night time.
There are multiple day long wind droughts across the NEM which see aggregate wind farm output falling to less than 500MW.
The choke point is real and we are going to be hit with the consequences of believing installed capacity is something to celebrate.
Ben, very interesting set of facts and figures. On a point of clarification: In the Outlook section you talk about a forecast pipeline of ” between 500 MW and 1 GW per month” but in the charts just below, it looks like those are quarterly figures not monthly? incidentally, you might want to swap the titles of those charts around…