I’d previously noted on Friday 22nd January that there were high temperatures and high demand forecast for a few days – so, given the time today invested in walking through all 722 pages of the new Generator Statistical Digest 2020, I’ve been keeping an ear out to the audible alerts running on the display copy of the ez2view in the background.
————
With respect to the GSD2020, we had been aiming for a release on Wednesday 27th January 2021 … but general busyness, and the complexity of wrangling the enormous effort to put together this ‘two complex pages for every operational DUID’ report means that we’ll be a few days later than initially intended. It looks like:
1) we’ll be delivering access to all who have pre-ordered on Friday 29th January 2021; with
2) a wider ‘release’ on Monday 1st February 2021 … at which point the price will revert to the ‘price on release’.
Hence that means there’s still about a week remaining to save $300exGST by submitting your pre-order now prior to the release.
————
Anyhow, back to the events in the market today, and a few interesting events…
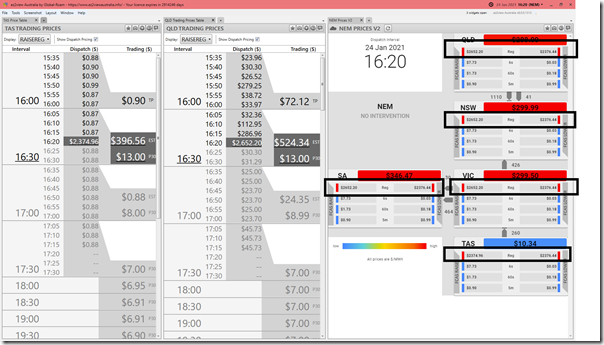
(A) Spike in Regulation FCAS prices from 16:20
Firstly, we noted that prices for Regulation FCAS spiked across all 5 regions (both Raise and Lower) in the 16:20 dispatch interval, as shown in this snapshot from an internal beta of ez2view v8:
(click on any image to open in fuller view).
(B) AEMO notifies of SCADA Failure at 16:33
Then there was Market Notice 082330 published at 16:33 that was as follows:
__________________________________________________
Notice ID : 82330
Notice Type ID : Emergency events/conditions
Notice Type Description : MARKET
Issue Date : Sunday, 24 January 2021
External Reference : AEMO SCADA Failure NEM -24/01/2021
__________________________________________________
AEMO is currently experiencing failure of SCADA in all regions.
AEMO is investigating the failure.
Manager NEM Real Time Operations
This may have had an effect on events below … at least in QLD.
(C) Spike in QLD Energy prices from 16:35 and 16:40
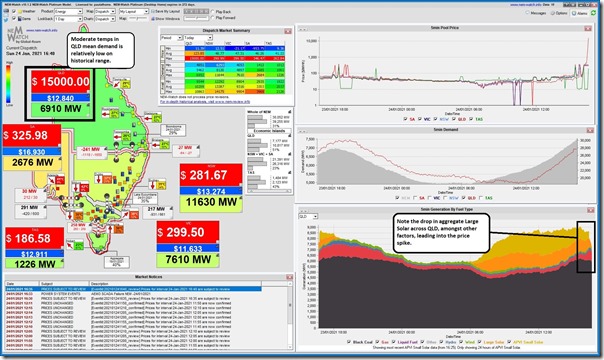
Coincidentally, the QLD price spiked high in the 16:35 (to $2,173.06/MWh)and 16:40 (to $15,000/MWh) dispatch intervals – here’s the 16:40 dispatch interval captured in NEMwatch v10 at the time:
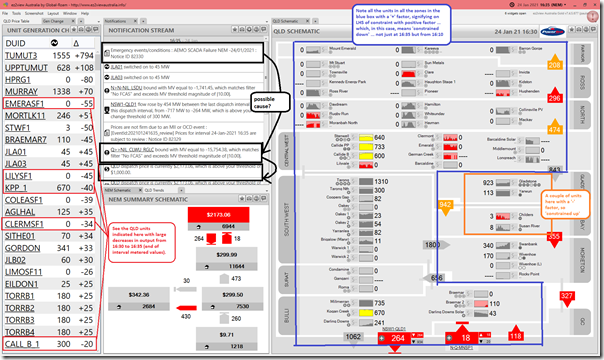
As noted in the snapshot above, we can see that (one of) the contributing factors was the sharp drop in collective contribution from Large Solar Farms across QLD. The reason behind the spike can be seen when we Time-Travel ez2view back to 16:35 (i.e. the first spike) and see greater detail of what was happening in the QLD region:
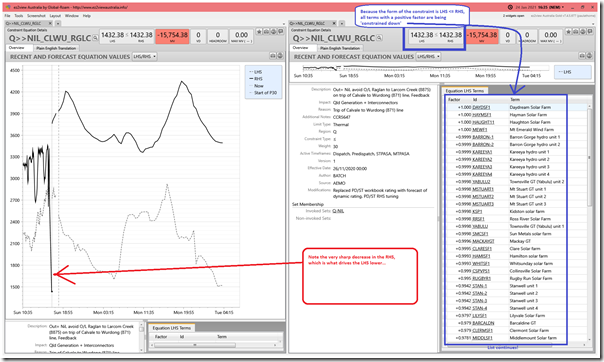
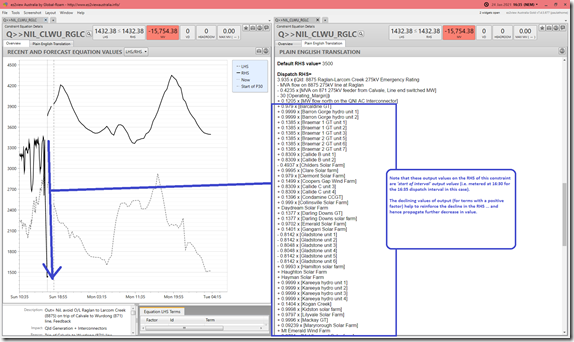
The ‘Q>>NIL_CLWU_RGLC’ constraint equation that is shown to be bound here looks to be the one here responsible for sharply winding back output of so many of the QLD generators … not just the Large Solar farms. We can see more when drilling into that particular widget in ez2view as shown here:
We see that the form of the constraint (i.e. LHS <= RHS) means that the terms with a positive factor (including QNI) are being ‘constrained down’ by the effect of the constraint binding. In the image above, I have also noted a clear drop in the RHS of the constraint over the dispatch intervals immediately beforehand. So flipping the widget on the right to look at the RHS through the AEMO’s (so called!) ‘Plain English Translation’ we see something interesting:
OOps, forgot to add diagram in here!
In his article of 23rd November, guest author Allan O’Neil explained how ‘WTF’ is sometimes shorthand for ‘Wait, there’s Feedback’, in the form of using the ‘start of interval’ values for actual outputs in determining part of the RHS values … which go on to set the LHS maximum amount and hence (if constrained) the outputs of the same DUIDs.
1) Today’s constraint in QLD was another one of those, as shown in the RHS diagram above;
2) Which makes me wonder … if SCADA data was lost for the period from 16:10 for some of the QLD DUIDs that make up the feedback loop in the RHS, would this have been the reason why the RHS total dropped rapidly … hence reinforcing a negative feedback loop that constrained off a substantial volume of generation and hence leading to the price spike.
If this was the case, then perhaps ‘WTF’ might take on it’s more usual meaning?
Can someone more knowledgeable confirm this for me please?
(D) Stresses in South Australia
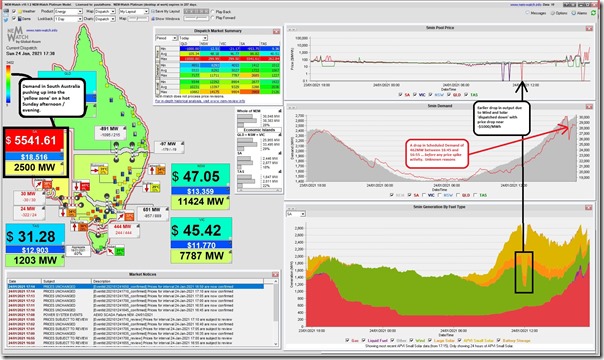
At the other end of the NEM, the hot weather in South Australia has driven demand higher and resulted in some yo-yo-ing prices. The snapshot from NEMwatch v10 shows the 17:30 dispatch interval (NEM time) where the dispatch price hit $5,541.61/MWh:
I’ve also noted on the image:
1) The drop in aggregate output from Wind and Large Solar following the surprise price drop down to –$953.75/MWh at 11:40 (NEM time).
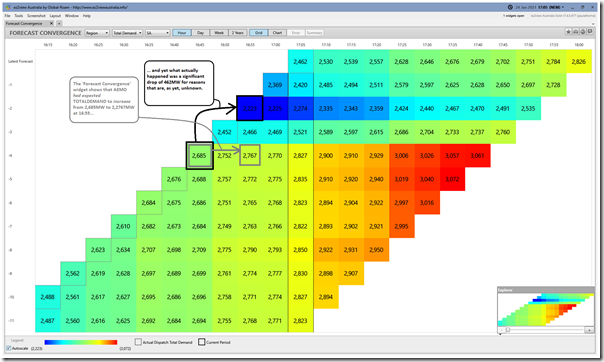
2) A large (462MW) drop in TOTALDEMAND (i.e. a measure of ‘Scheduled Demand’) between 16:45 and 16:55 that was for unknown reasons and, as shown in the ‘Forecast Convergence’ widget in ez2view, was not forecast ahead of time:
Also notable was Market Notice 82347 issued at 17:44 warning of an Actual LOR1 Lack of Reserve Level for the South Australian Region:
__________________________________________________
Notice ID : 82347
Notice Type ID : LRC/LOR1/LOR2/LOR3
Notice Type Description : MARKET
Issue Date : Sunday, 24 January 2021
External Reference : Actual Lack Of Reserve Level 1 (LOR1) in the SA region – 24 Jan 2021
__________________________________________________
AEMO ELECTRICITY MARKET NOTICE
Actual Lack Of Reserve Level 1 (LOR1) in the SA region – 24 Jan 2021
An Actual LOR1 condition has been declared under clause 4.8.4(b) of the National Electricity Rules for the SA region from 1740 hrs.
The Actual LOR1 condition [is forecast to exist until 2000 hrs.
The capacity reserve requirement is 420 MW
The minimum capacity reserve available is 240 MW
Manager NEM Real Time Operations
Events in South Australia continue at the time (18:32) that this article is published….
(E) What will happen tomorrow?
I’ve looked quickly and see expectations for demand in Victoria tomorrow are more moderated than what we saw on Friday, but (nevertheless) we will be keeping an eye out…


Looks like NEM frequency went rather out of band (~50.2Hz!) during the scada outage, this might have tripped some solar. I was looking for public data on DUID responses to frequency excursion, but this is also SCADA based.